Publishing on Pypi #23
Comments
|
The packaging should be relatively straight forward. The refactor may be slightly more tricky, though your current codes to fetch argo data will be a big help. Currently the user has to define many things for the OWC toolbox to run: For the update salinity mapping, they need to define:
Many of these parameters have a default value, but I know operators change them regularly That brings variables for salinity mapping to 15, which is somewhat tricky to manage in a usable way. Either we will need to group some of these variables together (into classes or dictionaries?), OR we can split the update salinity mapping routine up into separate routines that can be called? For calculate piecewise fit (which I have not pushed to master yet, as I'm still working on some bugs) users need the output from the salinity mapping routine, plus:
You can see an example of the set up here: https://github.com/ArgoDMQC/matlab_owc/blob/master/matlab_codes/set_calseries.m |
|
Could we write a class that has setters and getters for these values, and then we can just pass in the class to an update_salinity_mapping routine? Or just have the salinity mapping routine be a method in the class, of course. Class could contain an object containing all of the argo_profiles fetched from the argo_fetcher routine, variables for the update salinity mapping route, and the update salinity mapping method..? |
|
Discussion moves toward another topic here, I suggest to continue here euroargodev/User-Acceptance-Test-Python-version-of-the-OWC-tool#7 |
|
Dear all, Solution 1py_owc does the mathematics of calibration, users handle visualization. In order to run and compute the calibration, we don't need to plot anything. py_owc still provide plotting features, but does not make it a requirement for installation.
cons:
Solution 2py_owc does the mathematics of calibration and shows users the results for decision making. We consider that plotting is a key feature or step of the analysis.
cons:
Please provide comments or choose which solution you promote 1 vs 2 |
|
The plots are essential. I don't understand the difference between (1) and (2). One way or another the user will have to produce the plots. Does (1) make the plots optional? |
When we want to distribute a python software, we need to explicitly define a list of third party libraries, supposedly required for the software to run. Solution 1 does not include plotting 3rd party lib., Solution 2 does.
No, in both cases, py_owc includes plotting functions. This is like a radio in a car, it's an optional feature. We need to decide if plotting capabilities comes by default (solution 2) or if it's an optional feature (solution 1). |
|
OK, I see - this is more of a software packaging dilemma. (1) is the more modular approach, which may be better for software management. |
|
While investigating #3 , I have discovered that pip does not use underscores in package names (they are discouraged in PEP8). So, even if we work with pip install py-owcI dislike this idea and would prefer to work everywhere with the same name. So, new proposition, what about a simple software named: pyowcI think we still do the link with |
|
ok, let's go everywhere (but not repo name) with pyowc |
|
@apswong @gmaze I understand the conflict here - the plotting section is not needed to create the mapped salinity, nor is it needed to calibrate the salinity of floats. There are two crucial points to make though:
I realise that this could make pyowc a little more clunky to install, and more challenging to maintain, but it seems to me that, if we want this consistency, then it really does need to be included. Interested to hear what @matdon17 and @kamwal have to say here too. |
|
re-opening this issue because we didn't decided solution 1 vs 2 ps: yes @edsmall-bodc you're right, your point 2 is very good |
|
What @edsmall-bodc has said reflects my position. I do see there being the potential for pyowc being a module in a wider ecosystem of Argo QC tools though, and could be seen as a module of that wider landscape. Although quite what the shape that might take is one for the future. The only thing which has just occurred to me is whether we treat the trajectory plot alone as a module - as that is the one that seems to bring the most headaches with setup and dependencies (?). I am not convinced in either direction though. |
|
I like this idea as well - the trajectory plot is probably the least useful plot in terms of decision making (though, if I am wrong someone is free to correct me on this) and is probably the plot that causes the biggest headache. We could make the plot optional in installation, but provide some basic instructions/suggestions on how to plot trajectory. There is also the fact that the trajectory plot is probably the plot most likely to be able to be used by other software that might have nothing to do with salinity calibration, so it would make sense to have a stand alone trajectory plotting routine that every argo tool could use..? Or we add it as a feature in argopy? If you are fetching argo data, it is likely you might want to plot the locations, perhaps? |
|
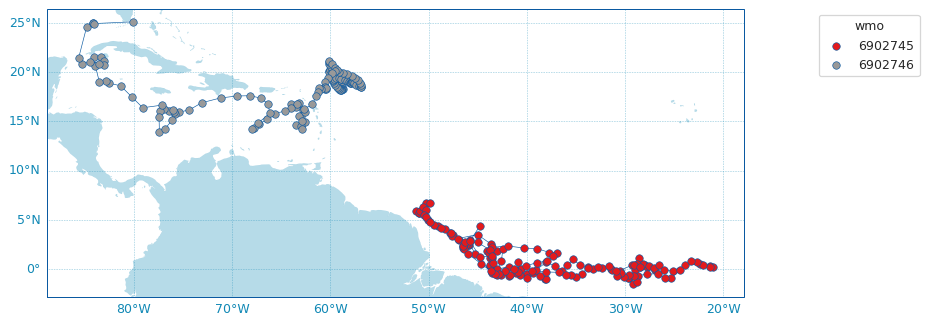
Plotting the trajectory is definitely a generic plot see here: https://argopy.readthedocs.io/en/latest/visualisation.html#trajectories-from-an-index this is clearly a very simple plot and yet that needs a lot of tuning to suit all possible floats. |
|
Something I think we should consider adding at some point is something that fetches topology data from somewhere like GEBCO for the area of interest. This would mean the plot would contain very accurate and detailed bathymetry and coastlines, which is probably important in complex regions, near sandbars and islands etc. The topology data that I am currently using isn't very precise purely because storing all that data locally would take up a huge amount of space. |
|
Yes, I also had this in argopy :https://github.com/euroargodev/argopy/blob/6273ddef6c22c1676aec56d9689612dbfb8ab902/argopy/utilities.py#L451 |
For standard users of the software, they should not need to clone the repository to be able to run it, but rather simply install it using pip or conda.
This implies 2 things:
This is also to let you known that when this will be ready to publish euroargodev python softwares on pypi, I created a euroargodev account at https://test.pypi.org/user/euroargodev/ and https://www.pypi.org/user/euroargodev/
(don't be fulled by the picture, this is retrieved automatically from my email but will change soon, so that it is the EA logo).
The text was updated successfully, but these errors were encountered: