This quick start covers a minimal setup without clustering, if you would prefer to use a cluster please follow the docker-cluster quick start
Docker is a toolkit and a daemon which makes running foreign applications convenient, via containers.
This tutorial will help you run metrictank, its dependencies, and grafana for dashboarding, with minimal hassle.
Docker installation instructions
You will also need to install version >=1.6 of docker-compose
Ensure that $GOPATH/bin is added to your $PATH
If you already have Go installed, you can just:
go get github.com/grafana/metrictank/...
cd $GOPATH/src/github.com/grafana/metrictank
If you don't, you can just use git:
git clone https://github.com/grafana/metrictank.git
cd metrictank
If you have neither, just download the zip, extract it somewhere and cd into the metrictank directory.
The stack will listen on the following ports:
- 2003 tcp (metrictank's carbon input)
- 3000 tcp (grafana's http port)
- 6060 tcp (metrictank's internal endpoint)
- 8080 tcp (the graphite query endpoint)
- 8125 udp (statsd endpoint)
- 9042 tcp (cassandra)
If you already have something else listening on those ports (such as a carbon or grafana server), shut it down, as it will conflict.
Inside your copy of the repository, you can bring up the stack like so:
cd docker/docker-standard
docker-compose up
If this gives you the error service 'version' doesn't have any configuration options,
your version of docker-compose is too old and you need to update to >=1.6.
A bunch of text will whiz past on your screen, including temporary errors like:
metrictank_1     | waiting for cassandra:9042 to become up...
statsdaemon_1    | 2016/12/04 15:30:21 ERROR: dialing metrictank:2003 failed - dial tcp 172.18.0.5:2003: getsockopt: connection refused. will retry
metrictank_1     | waiting for cassandra:9042 to become up...
statsdaemon_1    | 2016/12/04 15:30:22 ERROR: dialing metrictank:2003 failed - dial tcp 172.18.0.5:2003: getsockopt: connection refused
And a little bit later you should see that metrictank starts its listener and statsdaemon connects to metrictank:
metrictank_1    | 2016/12/04 15:30:34 [I] metricIndex initialized in 326.379951ms. starting data consumption
metrictank_1    | 2016/12/04 15:30:34 [I] carbon-in: listening on :2003/tcp
metrictank_1    | 2016/12/04 15:30:34 [I] API Listening on: http://:6060/
statsdaemon_1   | 2016/12/04 15:30:35 now connected to metrictank:2003
Once the stack is up, metrictank should be running on port 6060 and you can query it with curl.
If you're running Docker engine natively, you can connect using localhost. If you're using Docker Toolbox (which runs containers inside a VirtualBox VM), the host will be the IP address returned by docker-machine ip.
$ curl http://localhost:6060/node
Output will be similar to the following:
{"name":"default","version":"0.9.0-342-g9c5a12c","primary":true,"primaryChange":"2018-09-07T19:29:10.200078519Z","state":"NodeReady","priority":0,"started":"2018-09-07T19:29:10.196587689Z","stateChange":"2018-09-07T19:29:10.200078795Z","partitions":[0],"apiPort":6060,"apiScheme":"http","updated":"2018-09-07T19:29:11.26049517Z","remoteAddr":""}
In your browser, open Grafana at http://localhost:3000 (or your docker-machine address) and log in as admin:admin.
If Grafana prompts you to change the password, you can skip it, since it doesn't matter for a local test setup.
In the "+" (Create) menu, hit Dashboard.
This opens the dashboard editor and has a selector open to add a new panel. Hit "Graph" for graph panel.
The panel will appear but not contain data yet. (Grafana documentation for graph panel).
Click on the title of the panel and hit 'edit'.
In the metrics tab you should see a bunch of metrics already in the root hierarchy:
service_is_statsdaemon: statsdaemon's own internal metrics which it sends to metrictank's carbon port.metrictank: internal stats reported by metrictankstats: metrics aggregated by statsdaemon and sent into metrictank every second. Will only show up if something actually sends metrics into statsdaemon (e.g. if graphite receives requests directly, you send stats to statsdaemon, etc)
Note that metrictank is setup to track every metric on a 1-second granularity. If you wish to use it for less frequent metrics, you have to modify the storage-schemas.conf, just like with graphite.
You can also send your own data into metrictank using the carbon input, like so:
echo "example.metric 123 $(date +%s)" | nc localhost 2003
Or into statsdaemon - which will compute statistical summaries - like so:
echo "hits:1|c" | nc -w 1 -u localhost 8125
You can then visualize these metrics in the panel by selecting them. Note: if you only send single points, you should change the draw mode to point (Display tab)
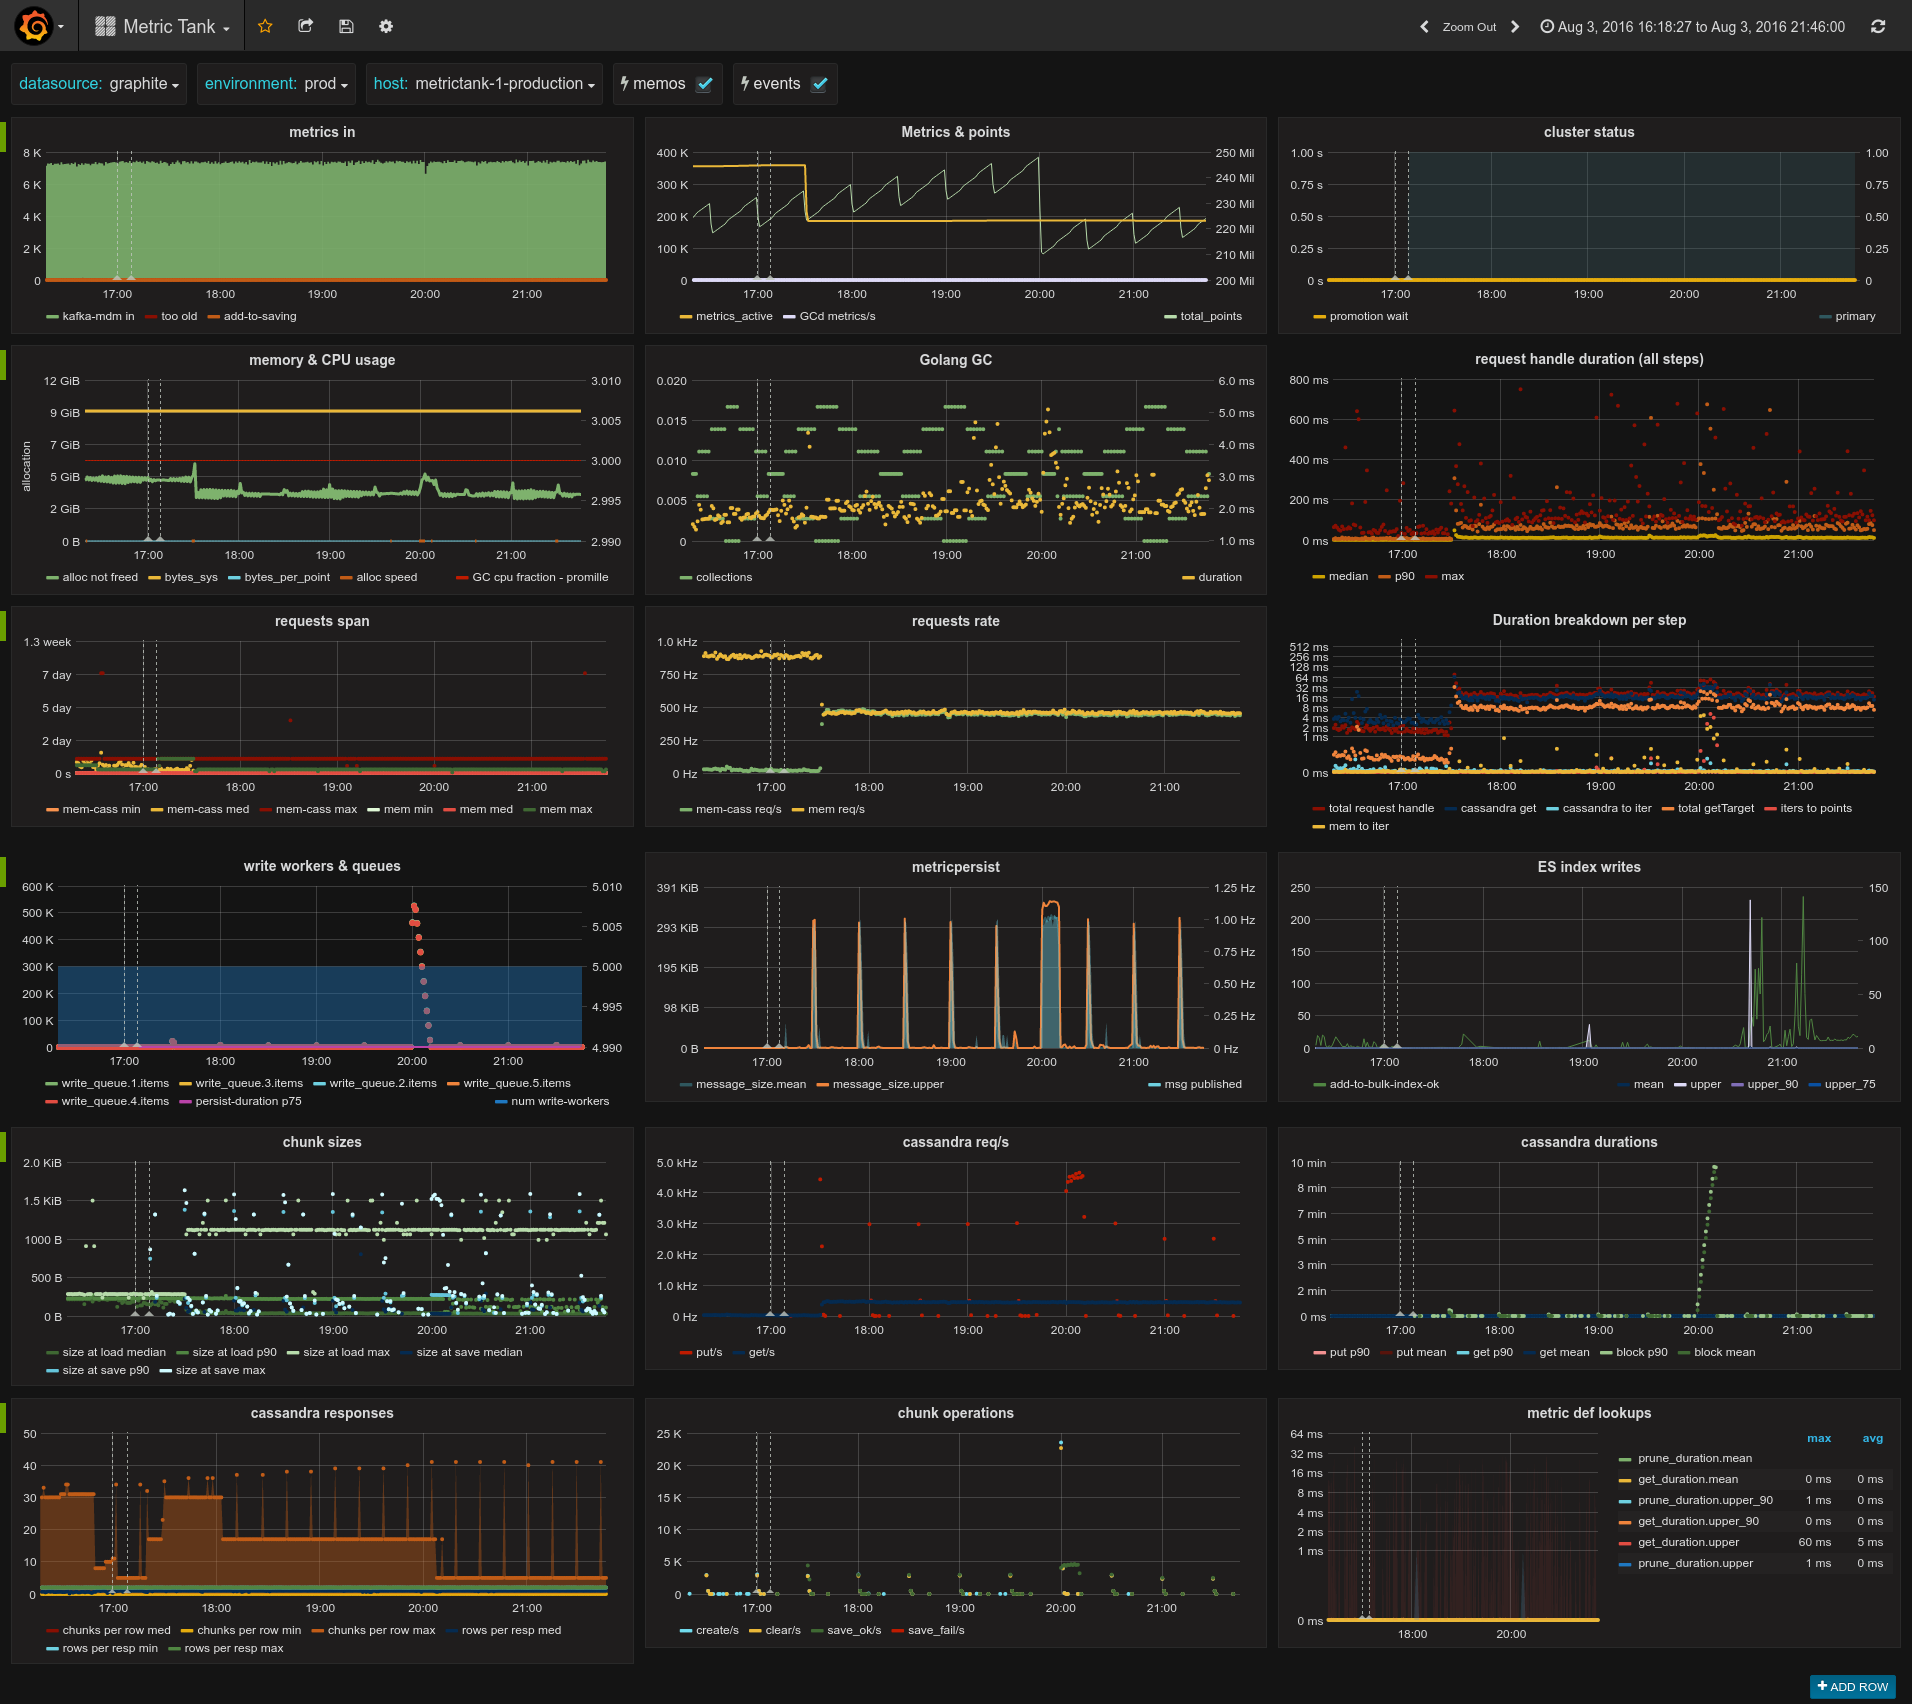
There is an extensive dashboard on grafana.net that displays all vital metrictank stats. This dashboard originates from the metrictank repository, and in fact, is also automatically imported into the stack when you spin it up. Go to the dashboard selector up on top and select "Metrictank". You should see something like the below. (if no data shows up, you may have opened it too soon after starting the stack. Usually data starts showing a minute after grafana has started. Refresh the page if needed)
You can also import dashboards from grafana.com
For example the statsdaemon dashboard which shows you metrics about the metrics received by statsdaemon. Very meta.
To import, go to the dashboard dropdown -> import dashboard -> and paste in https://grafana.net/dashboards/279 into the Grafana.net url field.
If it asks which datasource to use, enter metrictank.
Now you can send in more data using the plaintext protocol or using any of the plethora of tools that can send data in carbon format , create dashboards (or import them from grafana.net), etc.
fakemetrics is a handy tool to generate a data stream.
E.g. run fakemetrics feed --carbon-addr localhost:2003 and the stats will show up under some.id.of.a.metric.*
If anything doesn't work, please let us know via a ticket on github or reach out on slack. See Community
You can shut down the stack by just hitting Ctrl-C on your running docker-compose up command.
You can remove the containers like so:
docker-compose stop
To clean up all data so you can start fresh, run this after you stopped the stack:
docker rm -v $(docker ps -a -q -f status=exited)
This will remove the stopped containers and their data volumes.
The metrictank repository holds other stack configurations as well (for clustering, benchmarking, etc). See docker for more info.