Use CPU / Memory stats from Docker Host #793
Comments
|
Unfortunately, this would be extremely difficult to achieve. Cronicle measures server CPU and memory on each server by actually measuring the jobs it has running there, and the CPU/memory of each process owned by that job (including sub-processes, etc.), and then communicating that information back to the primary server, which uses it to select servers when using "Least CPU" or "Least Memory" algorithms. It does this by executing the https://github.com/jhuckaby/Cronicle/blob/master/lib/job.js#L1782 I'm not sure how this could be adapted to measure the host machine's CPU/memory, even if you somehow mounted the /proc filesystem inside the container, because even then, the code is measuring only its own processes and jobs it is running. I think this request is beyond the scope of Cronicle's abilities 😞 |
|
Thanks for the reply! Would it be possible to bypass this function entirely and inject some custom code/function on each node? Since I am interested in the total CPU/memory usage on the host vs the Cronicle process + jobs I can just parse It looks like Thanks for making Cronicle, it's letting me finally retire Jenkins 😄 |
Well, I think you probably could hack something in there. But first let me say that Cronicle v1 is in maintenance mode, and I am not adding any new features to it. I'm currently hard at work on Cronicle v2 which is a complete ground-up rewrite. And it actually already has this feature built-in. But I cannot easily backport it to v1, because it relies on a whole monitoring subsystem that has been incorporated into the software. So I guess what I am saying is, you can totally do this with Cronicle v2 when it comes out next year, if you can wait that long. I'm about 6 months away from release, I think. If you can't wait, then I think it would be possible to hack something into Cronicle v1, if you are comfortable with Node.js. I'd take a look at the chooseServer function, which has a switch statement that considers all the algorithms, and in there you will find For populating your custom values into the server data, this would be done in the monitorServerResources function that I linked above. In there, you could add some additional code to go look in your special case "least_host_mem":
// pick server with least host memory in use
var mems = {};
var servers = this.getAllServers();
for (var hostname in servers) {
mems[hostname] = 0;
if (servers[hostname] && servers[hostname].data && servers[hostname].data.host_mem) {
mems[hostname] = servers[hostname].data.host_mem;
}
}
var least_value = -1;
var least_hostname = '';
for (var idx = 0, len = candidates.length; idx < len; idx++) {
var hostname = candidates[idx].hostname;
if ((least_value == -1) || (mems[hostname] < least_value)) {
least_value = mems[hostname];
least_hostname = hostname;
}
}
server = Tools.findObject( candidates, { hostname: least_hostname } );
break;And then add another case for Now, for the UI. Cronicle was not designed for people adding new algorithms into the list, so it is hard-coded. You will have to edit the UI code and add your new algorithms, so you can select them: https://github.com/jhuckaby/Cronicle/blob/master/htdocs/js/pages/Schedule.class.js#L777 Each element in that array should have two sub-elements, one for the ID (e.g. var algo_items = [
['random',"Random"],
['round_robin',"Round Robin"],
['least_cpu',"Least CPU Usage"],
['least_mem',"Least Memory Usage"],
// our new ones:
['least_host_cpu',"Least Host CPU"],
['least_host_mem',"Least Host Memory"],
['prefer_first',"Prefer First (Alphabetically)"],
['prefer_last',"Prefer Last (Alphabetically)"],
['multiplex',"Multiplex"]
];Now, when you make changes to the UI code, it won't immediately reflect in the UI on a running server, because everything is bundled / compiled and served up as a gzip file. You will have to rerun the build script to regenerate all this: Make sure Cronicle is stopped before you do this. I'm sorry I cannot help you further, but as I said above, Cronicle v1 is in maintenance mode, and I just don't have the time to add, test and maintain new features. Answering your other questions:
Errr... bytes, not kilobytes, but otherwise yes.
Actually that was a deliberate design decision. Cronicle's CPU numbers are based on a single core equaling 100%, so 400% means 4 cores are maxed out. This follows the behavior of utilities like Anyway, good luck, and I'm sorry I could not help you further! |
|
I can definitely wait until next year - we don't have this feature in our current job scheduling - but I'm also very comfortable with Node so I may play around with it. Also thanks a lot for the detailed reply, it's super helpful. I'm curious to know more about v2 if you're looking for feedback or someone to pitch in. For the CPU numbers I know that they will add up to 400% for a maxed out 4 core, but in the "least_cpu" algorithm how will it know that a host has free cores without knowing the max? If 2 nodes both report 200% but one is a 2-core and the other is a 4-core how would it know to route the job to the server with 2 free cores? Perhaps a better solution would be to return core count and let the algorithm decide? Reporting the Docker host stats would be useful to me, but kind of for a specific reason - each host has an API instance and a Cronicle instance, and the local Cronicle instance calls the API on the same host via HTTP... so I want to pick the host that is the least busy overall vs the host with the Cronicle instance that is the least busy since it's just making HTTP calls. Moving the task code to the Cronicle container would help a bit but given our current architecture knowing the host stats would be useful for routing the jobs. Kind of niche, but also useful :) |
Okay, great! You're going to love v2 -- it's really slick. Can I ping you when it is closer to release? Your GitHub profile has a twitter link, so I can use that if it's appropriate.
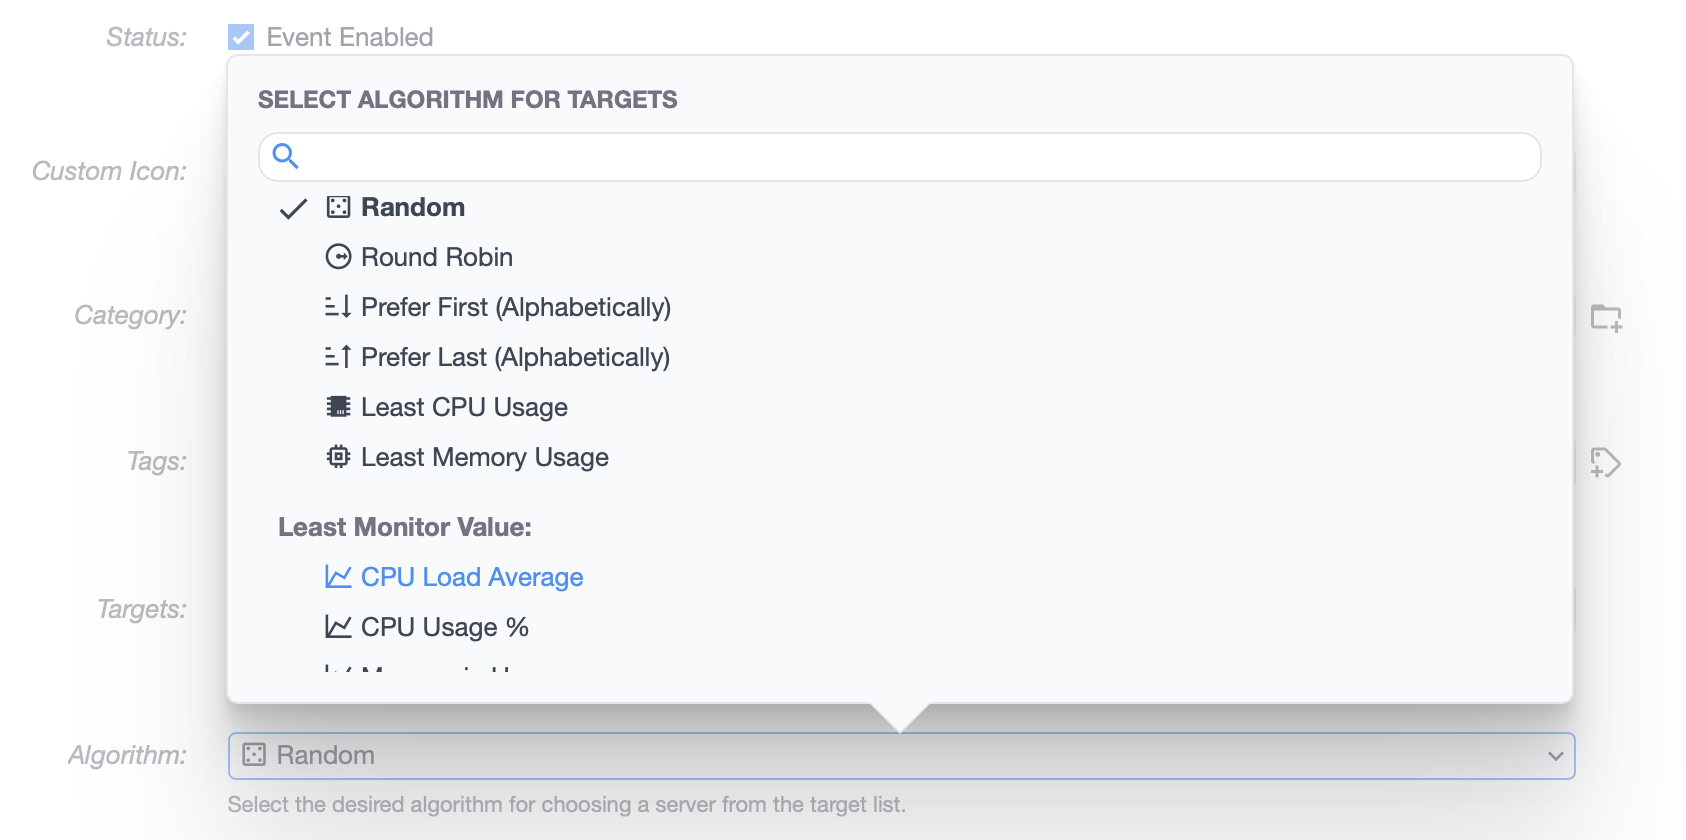
Yup, you're absolutely correct. Right now it just makes a decision based on the "absolute" CPU usage number, not taking into account the number of cores. Similarly, the "least memory" selection algorithm currently just acts on the total "memory in use" and doesn't account for the total RAM on the server. This is why I tore the entire system out and redesigned it in v2 😝. In v2 you can define your own custom "monitors" that include commands or scripts you execute on every server, and it can pull out values from the command output and even eval a math expression to arrive at a number, which is fed into the monitoring system and graphed over time. That value can also be used for job server selection, so this is just perfect for your needs. Those items at the bottom of the new algorithm list are totally custom, and user-defined. Each can run a custom script (in any language) to arrive at a number. The monitoring system runs every custom command once per minute.
Yup, I believe I understand. Can you get docker host stats from inside a container? If so, you should be able to tie this into the monitoring system in v2. Anyway, have a great day, and I'll talk to you soon! |
|
That looks great and definitely sounds like a solution for my use case. I only really need this to work on Linux, so my plan was to use a volume mount of Using # cpu | nice | system | idle | iowait | irq | softirq | steal | guest | guest_nice
$ cat /host_proc/stat
cpu 25160452 69999 7208952 1504574702 467712 0 1405623 6488757 0 0
cpu0 12632263 35254 3615238 752255945 232770 0 739563 3249213 0 0
cpu1 12528188 34745 3593714 752318756 234941 0 666060 3239544 0 0The values in $ cat /host_proc/meminfo
MemTotal: 7999096 kB
MemFree: 1042176 kB
MemAvailable: 5123972 kB
Buffers: 454020 kB
Cached: 2828968 kB
SwapCached: 0 kB
Active: 1990956 kB
Inactive: 3268856 kB
Active(anon): 1295684 kB
Inactive(anon): 700020 kB
Active(file): 695272 kB
Inactive(file): 2568836 kB
Unevictable: 34732 kB
Mlocked: 27616 kB
SwapTotal: 0 kB
SwapFree: 0 kB
Zswap: 0 kB
Zswapped: 0 kB
Dirty: 22228 kB
Writeback: 0 kB
AnonPages: 2011648 kB
Mapped: 456252 kB
Shmem: 2700 kB
KReclaimable: 1298720 kB
Slab: 1522476 kB
SReclaimable: 1298720 kB
SUnreclaim: 223756 kB
KernelStack: 15696 kB
PageTables: 41328 kB
SecPageTables: 0 kB
NFS_Unstable: 0 kB
Bounce: 0 kB
WritebackTmp: 0 kB
CommitLimit: 3999548 kB
Committed_AS: 10748976 kB
VmallocTotal: 34359738367 kB
VmallocUsed: 29728 kB
VmallocChunk: 0 kB
Percpu: 3312 kB
HardwareCorrupted: 0 kB
AnonHugePages: 2048 kB
ShmemHugePages: 0 kB
ShmemPmdMapped: 0 kB
FileHugePages: 0 kB
FilePmdMapped: 0 kB
Unaccepted: 0 kB
HugePages_Total: 0
HugePages_Free: 0
HugePages_Rsvd: 0
HugePages_Surp: 0
Hugepagesize: 2048 kB
Hugetlb: 0 kB
DirectMap4k: 78256 kB
DirectMap2M: 5040128 kB
DirectMap1G: 3145728 kB |
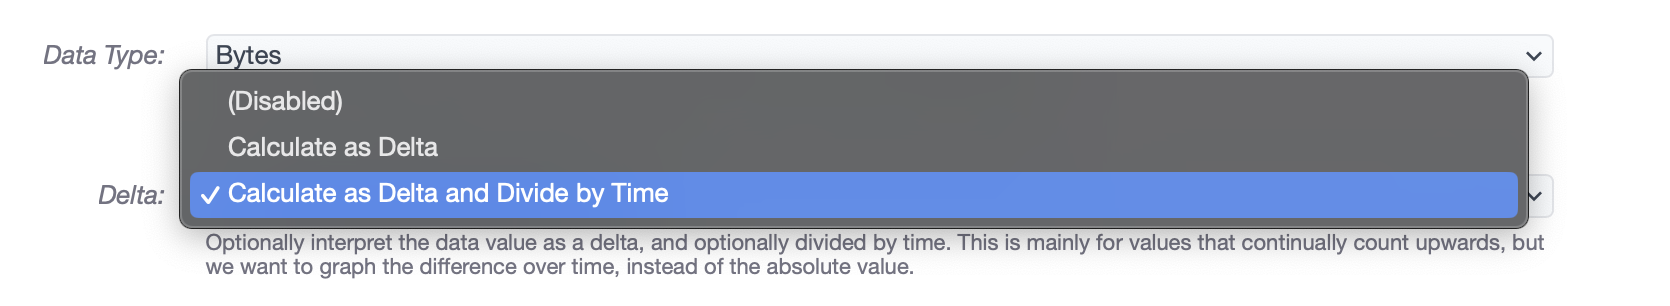
HAH! You're in luck, my friend. Cronicle v2 has a solution for this as well! Each custom monitor can be declared as a "Delta", where Cronicle tracks the delta between measurements, and you can even divide by the time offset, to get "growth / sec". 😃 |
|
I think that might be handy even if you run cronicle on bare metal, not just in container. Looks like right now cronicle uses output of ps command to sum up metrics for cronicle related PIDs. Sounds like it shouldn't be hard make an option to do this for all PIDs. When running in docker you can add option --pid=host, I believe it will make ps output the same in docker and the host. |
|
@mikeTWC1984 Yup, this has been redesigned in v2, so that now the "Least CPU" uses the system-wide load average, and "Least Memory" uses the system-wide "active" memory metric (both come from systeminformation). It no longer measures individual job PIDs for this purpose. Also, you can define your own custom "monitors" to measure literally anything you want, and use that as a server selection algorithm for jobs. |
Summary
I am running Cronicle on three EC2 servers in Docker containers. The host machine is running other Docker containers as well, so I would like to use the CPU and memory stats from the Docker host when selecting the which server to run jobs on. The host is running on Ubuntu so I can mount the
/procdirectory as a volume, but I am not sure how / if it's possible to parse the values here to use for the server stats.Steps to reproduce the problem
Running Cronicle in a docker container reports the CPU/memory usage for the container.
Your Setup
Docker Compose + bluet/cronicle-docker:0.9.39 running on Ubuntu.
Operating system and version?
Ubuntu
Node.js version?
Cronicle software version?
Version 0.9.39
Are you using a multi-server setup, or just a single server?
Mult-server
Are you using the filesystem as back-end storage, or S3/Couchbase?
S3
The text was updated successfully, but these errors were encountered: