Skip to content
New issue

Have a question about this project? Sign up for a free GitHub account to open an issue and contact its maintainers and the community.

By clicking “Sign up for GitHub”, you agree to our terms of service and privacy statement. We’ll occasionally send you account related emails.

Already on GitHub? Sign in to your account

Slow connect (TCP retransmits) via NodePort #76699

Closed
zigmund opened this issue Apr 17, 2019 · 54 comments · Fixed by #78547
Closed

Slow connect (TCP retransmits) via NodePort #76699

zigmund opened this issue Apr 17, 2019 · 54 comments · Fixed by #78547
Assignees
Labels
kind/bug Categorizes issue or PR as related to a bug. priority/important-soon Must be staffed and worked on either currently, or very soon, ideally in time for the next release. sig/network Categorizes an issue or PR as relevant to SIG Network.
Milestone

Comments

@zigmund
Copy link

zigmund commented Apr 17, 2019

What happened:
In out archutecture we have some kinda external (out-of-cluster) Ingress Controller, based on HAProxy + self-written scripts for Kubernetes service discovery (2 instances). ~60 Kubernetes services exposed via NodePort on 8 Kubernetes nodes. Each node runs kube-proxy in iptables mode.

Everything worked fine. But after cluster got more load (HTTP requests per second / concurrent connections), we are experiencing slow connects to services exposed via NodePort because of TCP retransmits.

For now have 4k RPS / 80k concurrent peak. TCP retransmits starts at ~1k RPS / 30k concurrent.

But most strange thing in this situation - retransmit count not same for haproxy/kube-node pair.
For example, haproxy1 have retransmits from kube-nodes 1,2,3 and 8, but haproxy2 have almost zero retransmits from that nodes. Instead haproxy2 have retransmits from kube-nodes 4,5,6 and 7. As you can see, it is like mirrored.

See attachments for clarification. HAProxy configured with 100ms connect timeout, so it redispatches connection on timeout.
haproxy1
haproxy2

What you expected to happen:
No TCP retransmits, fast connects.

How to reproduce it (as minimally and precisely as possible):
Commit 50-60 deployments + NodePort-exposed services on few nodes. Load with 1k+ RPS, 30k+ concurrent cons. Observe slow connects (1s, 3s, 6s...)

Anything else we need to know?:
Intercluster communication via flannel w/o cni in hostgw mode.

Tried different sysctls on nodes and haproxies. Tried ipvs mode and got much more TCP retransmits.
Also tried with iptables 1.6.2 with latest flanneld to fix NAT bugs according to this article: https://tech.xing.com/a-reason-for-unexplained-connection-timeouts-on-kubernetes-docker-abd041cf7e02

For test installed on kube-nodes out-of-cluster reverse-proxy to pass traffic from outside to kubernetes services and pods - no problems. Also no problems with HostPort-exposed services.

Environment:

  • Kubernetes version (use kubectl version):
    Client Version: version.Info{Major:"1", Minor:"11", GitVersion:"v1.11.6", GitCommit:"b1d75deca493a24a2f87eb1efde1a569e52fc8d9", GitTreeState:"clean", BuildDate:"2018-12-16T04:39:52Z", GoVersion:"go1.10.3", Compiler:"gc", Platform:"linux/amd64"} Server Version: version.Info{Major:"1", Minor:"11", GitVersion:"v1.11.6", GitCommit:"b1d75deca493a24a2f87eb1efde1a569e52fc8d9", GitTreeState:"clean", BuildDate:"2018-12-16T04:30:10Z", GoVersion:"go1.10.3", Compiler:"gc", Platform:"linux/amd64"}
  • Cloud provider or hardware configuration:
    Masters: 5 x kvm VMs 16.04.6 LTS (Xenial Xerus) / 4.15.0-45-generic.
    Nodes: Baremetall Supermicro Intel(R) Xeon(R) CPU E5-2695 / 128 Gb RAM
  • OS (e.g: cat /etc/os-release):
    Prod nodes: 16.04.6 LTS (Xenial Xerus)
    Test node: Debian GNU/Linux 9 (stretch)
  • Kernel (e.g. uname -a):
    Prod nodes: Linux hw-kube-n1.alaps.kz.prod.bash.kz 4.15.0-45-generic #48~16.04.1-Ubuntu SMP Tue Jan 29 18:03:48 UTC 2019 x86_64 x86_64 x86_64 GNU/Linux
    Test node: Linux hw-kube-n8.--- 4.9.0-8-amd64 #1 SMP Debian 4.9.144-3.1 (2019-02-19) x86_64 GNU/Linux
  • Install tools:
    Mix of hard way / ansible.
  • Others:
    Don't know if it is kube-proxy / iptables problem or maybe I'm just missing some sysctls / kernel params.
@zigmund zigmund added the kind/bug Categorizes issue or PR as related to a bug. label Apr 17, 2019
@k8s-ci-robot k8s-ci-robot added the needs-sig Indicates an issue or PR lacks a `sig/foo` label and requires one. label Apr 17, 2019
@zigmund
Copy link
Author

zigmund commented Apr 17, 2019

/sig network

@k8s-ci-robot k8s-ci-robot added sig/network Categorizes an issue or PR as relevant to SIG Network. and removed needs-sig Indicates an issue or PR lacks a `sig/foo` label and requires one. labels Apr 17, 2019
@athenabot
Copy link

/triage unresolved

Comment /remove-triage unresolved when the issue is assessed and confirmed.

🤖 I am a bot run by @vllry. 👩‍🔬

@k8s-ci-robot k8s-ci-robot added the triage/unresolved Indicates an issue that can not or will not be resolved. label Apr 17, 2019
@yanghaichao12
Copy link
Contributor

Is the route from haproxy2 to 12328 and from haproxy2 to 456 different?

@zigmund
Copy link
Author

zigmund commented Apr 18, 2019

@yanghaichao12 routes absolutelly the same. Both haproxies in same /24 network. All kubernetes nodes in same /24 network.

@zigmund
Copy link
Author

zigmund commented Apr 18, 2019

Also kubernetes nodes connected to network with lacp bonds. To check if problem in bond balancing I've disassemblied bond on 8 node and connected with one interface. But nothing changed.

@yanghaichao12
Copy link
Contributor

have you check conntrack numbers,like this:

 cat /proc/sys/net/netfilter/nf_conntrack_max
 cat /proc/sys/net/netfilter/nf_conntrack_count

@zigmund
Copy link
Author

zigmund commented Apr 18, 2019

@yanghaichao12 yes, these numbers are monitored.
8 node, for example:

$ cat /proc/sys/net/netfilter/nf_conntrack_max
3670016
$ cat /proc/sys/net/netfilter/nf_conntrack_count
66317

@yanghaichao12
Copy link
Contributor

have you check conntrack state? are there any "INVALID" connection? or what's the result:

cat /proc/sys/net/ipv4/netfilter/ip_conntrack_tcp_be_liberal

@zigmund
Copy link
Author

zigmund commented Apr 23, 2019

have you check conntrack state? are there any "INVALID" connection?

Yes, there are many invalid connections according to conntrack -S and the counters keep growing.

Also there are many insert_failed connections with iptables 1.6.1 and only few with iptables 1.6.2. (https://tech.xing.com/a-reason-for-unexplained-connection-timeouts-on-kubernetes-docker-abd041cf7e02). But seems it influences only outgoing connections from containers to outside world.

or what's the result:

cat /proc/sys/net/ipv4/netfilter/ip_conntrack_tcp_be_liberal

Tried both net.netfilter.nf_conntrack_tcp_be_liberal 0 and 1. At the moment nodes 1-7 with net.netfilter.nf_conntrack_tcp_be_liberal=1 and node 8 with net.netfilter.nf_conntrack_tcp_be_liberal=0. And seems it doesn't affect tcp retrans rate.

@MikeSpreitzer
Copy link
Member

This smells like more of the same kernel bug discussed in that article.

Are you with XING Engineering?

Maybe I missed it, but I did not notice where the article said the latest flannel would fix the problem.

As far as iptables is concerned, that article said the authors created a patch that was "merged (not released)". Do you know whether that patch is in iptables 1.6.2?

Have you tried printing out the relevant iptables rules? I am not real familiar with the iptables code, but it looks like that patch includes a change to the printing that exhibits the full random setting when/where it is applied.

To confirm my understanding: your problem is slow connections and HAProxy reports redispatching (not retransmissions), right?

Have you tried simplifying the situation? My suspicion is drawn to the masquerading that is part of the NodePort Service functionality; HAProxy is not an essential part of it. It looks like you are describing synthetic tests applied in a lab environment. Have you tried pointing your load generator directly at a cluster node?

Have you tried capturing packets and looking to see where the SYN goes missing?

@MikeSpreitzer
Copy link
Member

MikeSpreitzer commented Apr 25, 2019

Also, if I understand that kernel bug correctly, it is more likely to bite the fewer the destinations. Does your problem occur more frequently when there are fewer services involved? It may be easier to diagnose if only one service is involved.

Has the fundamental kernel bug (the race condition) been fixed? If so, could you try a kernel with the fix?

Could you be running out of ports?

@zigmund
Copy link
Author

zigmund commented Apr 25, 2019

@MikeSpreitzer patch is in iptables 1.6.2. I've checked flannel's repo and found --random-fully PR that was merged few month ago: flannel-io/flannel#1040. Latest release (v0.11.0) contains this code.

Currently node 8 is only node in cluster with iptables 1.6.2 + latest flannel and I see --random-fully NAT rules that I don't see on other nodes:

$ sudo iptables-save | grep -i fully
-A POSTROUTING -s 10.252.0.0/16 ! -d 224.0.0.0/4 -j MASQUERADE --random-fully
-A POSTROUTING ! -s 10.252.0.0/16 -d 10.252.0.0/16 -j MASQUERADE --random-full

Yes, our problem is slow connections from HAProxy. Retransmission and redispatches in HAProxy, as I understand, near same things. The difference: retransmission - retry on same server, redispatch - retry on other server in group.

It is not a lab with load generator. It is our live traffic and we cannot reduce service count.

Tried to capture traffic between nodes and HAProxies and saw TCP retransmits, but cannot find root cause since I'm not so strong in low level networking. Also tried to capture traffic on nodes, but it is much harder to do this in NATed-bridged-namespaced environment.

Cannot find information about current state of kernel bug.

@zigmund
Copy link
Author

zigmund commented Apr 25, 2019

At the moment we stabilized situation. Enabled keep-alive everywhere we can (clients, loadbalancers, microsevices) and no retransmits anymore. So I think we are really were out of ports somewhere (namespaced networks?) but cannot catch this.

Any method to monitor POD networks to avoid such situation?

@MikeSpreitzer
Copy link
Member

It looks like you do not have --random-fully where you need it. Here is what I see on one of my nodes (which is using Calico):

# iptables-save | grep MASQUERADE
-A KUBE-POSTROUTING -m comment --comment "kubernetes service traffic requiring SNAT" -m mark --mark 0x4000/0x4000 -j MASQUERADE
-A cali-POSTROUTING -o tunl0 -m comment --comment "cali:SXWvdsbh4Mw7wOln" -m addrtype ! --src-type LOCAL --limit-iface-out -m addrtype --src-type LOCAL -j MASQUERADE
-A cali-nat-outgoing -m comment --comment "cali:flqWnvo8yq4ULQLa" -m set --match-set cali40masq-ipam-pools src -m set ! --match-set cali40all-ipam-pools dst -j MASQUERADE

The first rule listed, for KUBE-POSTROUTING, is the one that does the masquerading for an inbound request to a NodePort service (as well as for other cases)

@MikeSpreitzer
Copy link
Member

MikeSpreitzer commented Apr 26, 2019

Also, the prospect of running out of ports for masquerading concerns me. Can you outline the calculation? How large is the rage of port numbers used for this purpose? The load is spread among 8 nodes, right? If I understand correctly, on the first Node it hits the initial SYN packet's source NAT is done after its destination NAT; that means the number of endpoints, rather than the number of services, is the relevant quantification of that side. Does conntrack re-use a source port number for different destinations? How long does each connection last? How long does conntrack retain the association after the last packet is seen?

What happens if you do run out of ports? Is an error logged anywhere?

@yanghaichao12
Copy link
Contributor

@zigmund can you get any vulable information in system log?like dmesg something

@zigmund
Copy link
Author

zigmund commented Apr 26, 2019

-A KUBE-POSTROUTING -m comment --comment "kubernetes service traffic requiring SNAT" -m mark --mark 0x4000/0x4000 -j MASQUERADE

This rule is added by kubelet (or kube-proxy?) and I found only one relevant closed ticket: #62628

The load is spread among 8 nodes, right?

Right.

If I understand correctly, on the first Node it hits the initial SYN packet's source NAT is done after its destination NAT; that means the number of endpoints, rather than the number of services, is the relevant quantification of that side.

Yes. DNAT is PREROUTING action while SNAT is POSTROUTING.

Does conntrack re-use a source port number for different destinations?

Conntrack can handle same src-ip:scr-port since all combination src-ip:scr-port:dst-ip:dst-port is unique. I see src-ip:src-port duplicates via conntrack -L -p tcp | awk '{print $5$7}' | sort | uniq -dc with different destinations.

How long does each connection last? How long does conntrack retain the association after the last packet is seen?

Some connections is out case are long lasting (websockets) and some not.

I believe connection tracking is controlled by sysctls:

net.netfilter.nf_conntrack_tcp_timeout_close = 10
net.netfilter.nf_conntrack_tcp_timeout_close_wait = 600
net.netfilter.nf_conntrack_tcp_timeout_established = 86400
net.netfilter.nf_conntrack_tcp_timeout_fin_wait = 120
net.netfilter.nf_conntrack_tcp_timeout_last_ack = 30
net.netfilter.nf_conntrack_tcp_timeout_max_retrans = 300
net.netfilter.nf_conntrack_tcp_timeout_syn_recv = 60
net.netfilter.nf_conntrack_tcp_timeout_syn_sent = 120
net.netfilter.nf_conntrack_tcp_timeout_time_wait = 120
net.netfilter.nf_conntrack_tcp_timeout_unacknowledged = 300

We have not changed these values since conntrack count far from max.

First thing I've done when we found the problem - lowered net.ipv4.tcp_fin_timeout to 15s and extended local port range to 1024-65535 on proxies and 32768-65535 on nodes.

It helped a lot, but not solved problem completelly. After enabling keep-alive (cut out connection: close header from clients) problems are gone.
image

Unfortunately I started to record node's conn count after changes and that metrics are useless in current situation. But I can say, that keep-alive redused TIME-WAIT conn count significantly, from thouthands to handreds. Conntrack conns also gone down from ~100k peak to ~60k.
image

Also we identified slow connections with high RPS from POD to kube service. For test I changed port range to 1024-65535 in pod via privileged init container and that solved the problem. At the moment we are patching our microservices to enable keep-alive when microservice acting as client.

@zigmund
Copy link
Author

zigmund commented Apr 26, 2019

According to formula for max outgoing requests per second:
max RPS = local port range / fin timeout.
so with stock sysctls it will:
(60999 - 32768) / 60 = ~470 RPS max

And I don't understand why extending port range in out case helped a lot.

For example, we have pretty loaded serviceA (3 POD replica) exposed via hostPortA on 8 nodes. One haproxy sending up to 500 RPS spreaded to 8 nodes. So it will be 470 / 8 = ~60 RPS. Far from limit.

Similiar situation on nodes' side. 60 RPS from each node spreaded to 3 endpoints...... I inspected connections on haproxies' side, nodes' side, PODs' side.

Also we had retransmits with less loaded services - 30..50 RPS.

@zigmund
Copy link
Author

zigmund commented Apr 26, 2019

@yanghaichao12 checked dmesg, kubelet, kube-proxy, flannel logs and there is no interesting information. :(

@yanghaichao12
Copy link
Contributor

@zigmund could you reproduce it in lab? i think it's easy because you said it occurred even with 30..50 RPS, right? and do you consider testing it in different kernel?

@zigmund
Copy link
Author

zigmund commented Apr 30, 2019

@yanghaichao12 less loaded services affected too, but only when overall cluster load is high.

I'll try to reproduce in lab with load generator.

@yanghaichao12
Copy link
Contributor

@zigmund so, Have you ever suspected it's probleme about HAproxy?

@MikeSpreitzer
Copy link
Member

Or, from the other direction: can you apply a load generator directly to a node & service NodePort, and get the same result, thus proving that HAProxy is not a critical part of the story?

@MikeSpreitzer
Copy link
Member

So you certainly are vulnerable to the conntrack collision problem, since the relevant iptables rule does not include --random-fully. I would focus on that first.

@joewilliams
Copy link

@zigmund what is your haproxy configuration for option redispatch and retries? Also, are you tracking fc_retrans and/or fc_lost in your haproxy logs or metrics? If so, what are you seeing there?

@zigmund
Copy link
Author

zigmund commented May 17, 2019

@joewilliams

        retries 5
        option redispatch

Currently we collecting almost everything can get from haproxy stats. For example, server stats:

{
  "qcur": "0",
  "qmax": "0",
  "scur": "0",
  "smax": "2",
  "slim": "0",
  "stot": "252089",
  "bin": "63365826",
  "bout": "64030592",
  "dreq": "0",
  "dresp": "0",
  "ereq": "0",
  "econ": "0",
  "eresp": "0",
  "wretr": "0",
  "wredis": "0",
  "status": "UP",
  "weight": "10",
  "act": "1",
  "bck": "0",
  "chkfail": "0",
  "chkdown": "0",
  "lastchg": "3619",
  "downtime": "0",
  "qlimit": "0",
  "pid": "1",
  "iid": "11",
  "sid": "1",
  "throttle": "0",
  "lbtot": "252089",
  "tracked": "0",
  "type": "2",
  "rate": "70",
  "rate_lim": "0",
  "rate_max": "84",
  "check_status": "L4OK",
  "check_code": "0",
  "check_duration": "0",
  "hrsp_1xx": "0",
  "hrsp_2xx": "252089",
  "hrsp_3xx": "0",
  "hrsp_4xx": "0",
  "hrsp_5xx": "0",
  "hrsp_other": "0",
  "hanafail": "0",
  "req_rate": "0",
  "req_rate_max": "0",
  "req_tot": "0",
  "cli_abrt": "0",
  "srv_abrt": "0",
  "comp_in": "0",
  "comp_out": "0",
  "comp_byp": "0",
  "comp_rsp": "0",
  "lastsess": "0",
  "last_chk": "0",
  "last_agt": "0",
  "qtime": "0",
  "ctime": "1",
  "rtime": "0",
  "ttime": "15",
  "agent_status": "0",
  "agent_code": "0",
  "agent_duration": "0",
  "check_desc": "Layer4 check passed",
  "agent_desc": "0",
  "check_rise": "20",
  "check_fall": "3",
  "check_health": "22",
  "agent_rise": "0",
  "agent_fall": "0",
  "agent_health": "0",
  "addr": "x.x.x.x:31997",
  "cookie": "0",
  "mode": "http",
  "algo": "0",
  "conn_rate": "0",
  "conn_rate_max": "0",
  "conn_tot": "0",
  "intercepted": "0",
  "dcon": "0",
  "dses": "0"
}

@MikeSpreitzer
Copy link
Member

/remove-triage unresolved

@k8s-ci-robot k8s-ci-robot removed the triage/unresolved Indicates an issue that can not or will not be resolved. label May 30, 2019
@MikeSpreitzer
Copy link
Member

I think the first thing to do is make kube-proxy add --random-fully to the MASQUERADE rule it emits. I will make a PR to do this.

@zigmund
Copy link
Author

zigmund commented May 31, 2019

Thanks, @MikeSpreitzer

Is there any workaround? I've tried to add rules manually to KUBE-POSTROUTING chain, but seems kube-proxy overwrites my rules.

@zigmund
Copy link
Author

zigmund commented May 31, 2019

@MikeSpreitzer

I've made custom chain with --random-fully masquerade and inserted rule to jump there before KUBE-POSTROUTING. Alse made this trick with docker's masquerade rule.

According to iptables' counters packets goes to correct chain. Monitored for few hours and didn't see any difference. :(

Chain POSTROUTING (policy ACCEPT 3902 packets, 297K bytes)
 pkts bytes target     prot opt in     out     source               destination         
  12M  957M KUBE-POSTROUTING-CUSTOM  all  --  *      *       0.0.0.0/0            0.0.0.0/0            /* custom kubernetes postrouting rules */
7662K  596M KUBE-POSTROUTING  all  --  *      *       0.0.0.0/0            0.0.0.0/0            /* kubernetes postrouting rules */
1552K  125M MASQUERADE  all  --  *      !docker0  10.252.212.0/22      0.0.0.0/0            random-fully
1497K  121M MASQUERADE  all  --  *      !docker0  10.252.212.0/22      0.0.0.0/0           
 254K   15M RETURN     all  --  *      *       10.252.0.0/16        10.252.0.0/16       
    0     0 MASQUERADE  all  --  *      *       10.252.0.0/16       !224.0.0.0/4          random-fully
4337K  333M RETURN     all  --  *      *      !10.252.0.0/16        10.252.212.0/22     
    0     0 MASQUERADE  all  --  *      *      !10.252.0.0/16        10.252.0.0/16        random-fully

...

Chain KUBE-POSTROUTING (1 references)
 pkts bytes target     prot opt in     out     source               destination         
    0     0 MASQUERADE  all  --  *      *       0.0.0.0/0            0.0.0.0/0            /* kubernetes service traffic requiring SNAT */ mark match 0x4000/0x4000
    0     0 MASQUERADE  all  --  *      *       0.0.0.0/0            0.0.0.0/0            /* Kubernetes endpoints dst ip:port, source ip for solving hairpin purpose */ match-set KUBE-LOOP-BACK dst,dst,src

Chain KUBE-POSTROUTING-CUSTOM (1 references)
 pkts bytes target     prot opt in     out     source               destination         
6645K  557M MASQUERADE  all  --  *      *       0.0.0.0/0            0.0.0.0/0            /* kubernetes service traffic requiring SNAT */ mark match 0x4000/0x4000 random-fully
    0     0 MASQUERADE  all  --  *      *       0.0.0.0/0            0.0.0.0/0            /* Kubernetes endpoints dst ip:port, source ip for solving hairpin purpose */ match-set KUBE-LOOP-BACK dst,dst,src random-fully

@MikeSpreitzer
Copy link
Member

Yes, kube-proxy maintains the rules in the KUBE-POSTROUTING chain.

I suppose you mean that you are still seeing SYN drops. Are you also looking at the insert_failed counter from conntrack -S? If so, does it correlate with SYN drops?

This may be grasping at straws, but I note that your experiment did not remove the KUBE-POSTROUTING chain. Is it possible that in your experiment the KUBE-POSTROUTING chain is being used as well a the KUBE-POSTROUTING-CUSTOM chain? Do you need the rules in the POSTROUTING chain after the jump to KUBE-POSTROUTING-CUSTOM? If not, can you try inserting a -j RETURN between the jumps to KUBE-POSTROUTING-CUSTOM and KUBE-POSTROUTING?

@zigmund
Copy link
Author

zigmund commented May 31, 2019

@MikeSpreitzer

Are you also looking at the insert_failed counter from conntrack -S? If so, does it correlate with SYN drops?

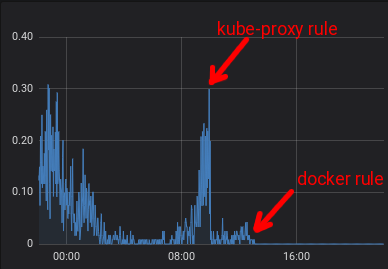
Almost no insert_failed after I enabled random-fully on kube-proxy and docker rules. See pic. First big drop of insert_failed/sec after I added kube-proxy's rule, second drop to zero is for docker's rule.
image

This may be grasping at straws, but I note that your experiment did not remove the KUBE-POSTROUTING chain.

I've tried to remove this rule, but kube-proxy recreates it almost instantly.

Is it possible that in your experiment the KUBE-POSTROUTING chain is being used as well a the KUBE-POSTROUTING-CUSTOM chain? Do you need the rules in the POSTROUTING chain after the jump to KUBE-POSTROUTING-CUSTOM? If not, can you try inserting a -j RETURN between the jumps to KUBE-POSTROUTING-CUSTOM and KUBE-POSTROUTING?

Packet goes to correct chain. MASQUERADE is terminating target, matched packet will not go to other rules, no need to add RETURN. I can confirm it with iptables counters:

# iptables -t nat -L -nv | grep "Chain KUBE-POSTROUTING" -A3
Chain KUBE-POSTROUTING (1 references)
 pkts bytes target     prot opt in     out     source               destination         
    0     0 MASQUERADE  all  --  *      *       0.0.0.0/0            0.0.0.0/0            /* kubernetes service traffic requiring SNAT */ mark match 0x4000/0x4000

Chain KUBE-POSTROUTING-CUSTOM (1 references)
 pkts bytes target     prot opt in     out     source               destination         
  12M  972M MASQUERADE  all  --  *      *       0.0.0.0/0            0.0.0.0/0            /* kubernetes service traffic requiring SNAT */ mark match 0x4000/0x4000 random-fully

I think random-fully made situation slightly better, but global problem is somewhere else.

@MikeSpreitzer
Copy link
Member

Oh, right, the counters you showed earlier say the same thing.

What changed after 08:00 to make insert_failed/sec go up again?

Why are the Docker rules involved?

@zigmund
Copy link
Author

zigmund commented May 31, 2019

What changed after 08:00 to make insert_failed/sec go up again?

It is our native load depending on daytime. I added kube-proxy rule at ~9:30 and docker rule at ~13:00.
image

Why are the Docker rules involved?

Since Docker have masquerade rule I decided to add random-fully to this rule too. The rule is for outgoing traffic from containers.

@fejta-bot
Copy link

Issues go stale after 90d of inactivity.
Mark the issue as fresh with /remove-lifecycle stale.
Stale issues rot after an additional 30d of inactivity and eventually close.

If this issue is safe to close now please do so with /close.

Send feedback to sig-testing, kubernetes/test-infra and/or fejta.
/lifecycle stale

@k8s-ci-robot k8s-ci-robot added the lifecycle/stale Denotes an issue or PR has remained open with no activity and has become stale. label Aug 29, 2019
@cblecker
Copy link
Member

cblecker commented Sep 1, 2019

/remove-lifecycle stale

@k8s-ci-robot k8s-ci-robot removed the lifecycle/stale Denotes an issue or PR has remained open with no activity and has become stale. label Sep 1, 2019
@MikeSpreitzer
Copy link
Member

/priority important-soon

@k8s-ci-robot k8s-ci-robot added the priority/important-soon Must be staffed and worked on either currently, or very soon, ideally in time for the next release. label Sep 3, 2019
@lachie83
Copy link
Member

lachie83 commented Sep 3, 2019

/milestone v1.16

@owenliang
Copy link

no final solutions?

@aaronbbrown
Copy link
Contributor

If it's helpful https://github.blog/2019-11-21-debugging-network-stalls-on-kubernetes/ describes the approach we took at GitHub to finding and mitigating most of these network stalls.

@danwinship
Copy link
Contributor

@zigmund so did our adding --random-fully to kube-proxy make things any better for you? Or was the problem somewhere else?

@zigmund
Copy link
Author

zigmund commented May 29, 2020

@danwinship --random-fully didn't solved the issue completelly. Conntrack invalids gone down but redispatches/retries are still here.

But the more nodes we use - less redispatches we have overall.
For example, redispatches per second, 3 nodes vs 8 nodes @ 100k concurrent connections 300 RPS via 2 haproxies:
image

@withlin
Copy link

withlin commented Apr 30, 2021

same problem

1 similar comment
@panhow
Copy link

panhow commented Mar 31, 2022

same problem

Sign up for free to join this conversation on GitHub. Already have an account? Sign in to comment
Labels
kind/bug Categorizes issue or PR as related to a bug. priority/important-soon Must be staffed and worked on either currently, or very soon, ideally in time for the next release. sig/network Categorizes an issue or PR as relevant to SIG Network.
Projects
None yet