Skip to content
New issue

Have a question about this project? Sign up for a free GitHub account to open an issue and contact its maintainers and the community.

By clicking “Sign up for GitHub”, you agree to our terms of service and privacy statement. We’ll occasionally send you account related emails.

Already on GitHub? Sign in to your account

feat: Adds the ECharts Bubble chart #22107

Merged
merged 25 commits into from
Oct 5, 2023

Conversation

mayurnewase
Copy link
Contributor

@mayurnewase mayurnewase commented Nov 13, 2022

SUMMARY

Adds the ECharts Bubble chart.

BEFORE/AFTER SCREENSHOTS OR ANIMATED GIF

  1. Chart and data control panel:
    Screenshot from 2022-11-23 10-52-20

  2. Customize control panel
    Screenshot from 2022-11-27 16-18-56

  3. Tooltip:
    Screenshot from 2022-11-23 11-11-23

TESTING INSTRUCTIONS

  1. create d3 bubble chart
  2. merge commits from this PR and open existing chart should work fine as before.
  3. test all controls in data and customize sections.

ADDITIONAL INFORMATION

  • Has associated issue:
  • Required feature flags:
  • Changes UI
  • Includes DB Migration (follow approval process in SIP-59)
    • Migration is atomic, supports rollback & is backwards-compatible
    • Confirm DB migration upgrade and downgrade tested
    • Runtime estimates and downtime expectations provided
  • Introduces new feature or API
  • Removes existing feature or API

@mayurnewase mayurnewase changed the title [WIP] feat: migrate bubble char to echarts [WIP] feat: migrate bubble chart to echarts Nov 13, 2022
@mayurnewase mayurnewase marked this pull request as ready for review November 23, 2022 05:17
@mayurnewase mayurnewase changed the title [WIP] feat: migrate bubble chart to echarts feat: migrate bubble chart to echarts Nov 23, 2022
@codecov
Copy link

codecov bot commented Nov 23, 2022

Codecov Report

Merging #22107 (df22d86) into master (389e44e) will increase coverage by 0.26%.
The diff coverage is 74.46%.

@@            Coverage Diff             @@
##           master   #22107      +/-   ##
==========================================
+ Coverage   66.65%   66.91%   +0.26%     
==========================================
  Files        1841     1852      +11     
  Lines       70220    70316      +96     
  Branches     7670     7684      +14     
==========================================
+ Hits        46804    47052     +248     
+ Misses      21434    21268     -166     
- Partials     1982     1996      +14     
Flag Coverage Δ
hive 52.55% <ø> (?)
javascript 53.84% <74.46%> (+0.18%) ⬆️
mysql 78.04% <ø> (-0.03%) ⬇️
postgres 78.11% <ø> (-0.03%) ⬇️
presto 52.45% <ø> (?)
python 81.30% <ø> (+0.36%) ⬆️
sqlite 76.57% <ø> (?)
unit 50.86% <ø> (-0.01%) ⬇️

Flags with carried forward coverage won't be shown. Click here to find out more.

Impacted Files Coverage Δ
.../plugin-chart-echarts/src/Bubble/EchartsBubble.tsx 0.00% <0.00%> (ø)
...ntend/plugins/plugin-chart-echarts/src/defaults.ts 100.00% <ø> (+80.00%) ⬆️
...-frontend/src/visualizations/presets/MainPreset.js 100.00% <ø> (ø)
...s/plugin-chart-echarts/src/Bubble/controlPanel.tsx 50.00% <50.00%> (ø)
...d/plugins/plugin-chart-echarts/src/Bubble/index.ts 50.00% <50.00%> (ø)
...gins/plugin-chart-echarts/src/Bubble/buildQuery.ts 66.66% <66.66%> (ø)
.../plugin-chart-echarts/src/Bubble/transformProps.ts 82.35% <82.35%> (ø)
...ugins/plugin-chart-echarts/src/Bubble/constants.ts 100.00% <100.00%> (ø)
...ugins/legacy-preset-chart-nvd3/src/Bubble/index.js 33.33% <0.00%> (-33.34%) ⬇️
...c/components/Chart/DrillDetail/DrillDetailPane.tsx 76.04% <0.00%> (-6.68%) ⬇️
... and 31 more

📣 We’re building smart automated test selection to slash your CI/CD build times. Learn more

? `${params.data[3]} <sub>(${params.data[4]})</sub>`
: params.data[3];

return `<p>${title}</p>
Copy link
Contributor Author

Choose a reason for hiding this comment

The reason will be displayed to describe this comment to others. Learn more.

didn't use echart's sanitize function, it removes line breaks.

Copy link
Member

@villebro villebro left a comment

Choose a reason for hiding this comment

The reason will be displayed to describe this comment to others. Learn more.

First pass comments, looks great! One thing that I noticed is that the NVD3 plugin assumes truncation on the y-axis if the bounds aren't set. While I don't necessarily like the idea of defaulting to truncation (actually, I strongly oppose it), I was just wondering if we should do a migration that enables truncation for existing charts if the bounds are undefined?

@mayurnewase
Copy link
Contributor Author

First pass comments, looks great! One thing that I noticed is that the NVD3 plugin assumes truncation on the y-axis if the bounds aren't set. While I don't necessarily like the idea of defaulting to truncation (actually, I strongly oppose it), I was just wondering if we should do a migration that enables truncation for existing charts if the bounds are undefined?

agree, added migration.

Copy link
Member

@villebro villebro left a comment

Choose a reason for hiding this comment

The reason will be displayed to describe this comment to others. Learn more.

A few more things that came to mind. Also, one major issue: the chart is heavily padded:
image
I quickly verified that by adding left: 0, right: 0 to the grid seemed to widen it to the full width, although it went a few pixels over. So I think we need to reuse the getPadding util from the Timeseries chart to get the grid right.

Copy link
Member

@zhaoyongjie zhaoyongjie left a comment

Choose a reason for hiding this comment

The reason will be displayed to describe this comment to others. Learn more.

I just saw the original bubble chart(NVD3 version), and the limit control have an inconsistent setting. IMO, we should fix/improve that in the new version of Bubble Chart.

  1. The Series Limit refers to a limit by series rather than a row limit.
  2. No chance to set a order by clause in the SQL

image

@mayurnewase
Copy link
Contributor Author

I just saw the original bubble chart(NVD3 version), and the limit control have an inconsistent setting. IMO, we should fix/improve that in the new version of Bubble Chart.

  1. The Series Limit refers to a limit by series rather than a row limit.
  2. No chance to set a order by clause in the SQL

image

here series limit made sense as its inline with echart's options.(every bubble is separate series)
and description of dimension in control panel had series in it to group them by color.

@zhaoyongjie
Copy link
Member

zhaoyongjie commented Nov 30, 2022

@mayurnewase the series limit will send a subquery instead a simple query, the time-series chart should be referenced.

@mayurnewase
Copy link
Contributor Author

@mayurnewase the series limit will send a subquery instead a simple query, the time-series chart should be referenced.

I see, let me check.

@villebro
Copy link
Member

FYI @mayurnewase @zhaoyongjie , slightly related, I'm opening a PR today that will clean up deprecated limit control logic from superset-ui/core so we can remove those annoying deprecation warnings on chart data requests

@mayurnewase
Copy link
Contributor Author

updated series limit to row limit, and added order control.

@zhaoyongjie the normalizeOrderBy in core doesn't support this control panel yet and I didn't want to change anything in core in this PR so added order support in the buildQuery itself.
Either this or need to something more hacky like below

orderby: normalizeOrderBy( { ...baseQueryObject, orderby: [ [...baseQueryObject.orderby, !baseQueryObject.order_desc] ] } ).orderby

what do you think?

@michael-s-molina
Copy link
Member

michael-s-molina commented Sep 19, 2023

Hi @mayurnewase. Thank you for this contribution. I would like to continue the work and see if we can ship this feature. To do that I can push to your PR if you give me the GitHub permission or I can close this PR, open my own and reference you as the original author. Which method do you prefer?

@mayurnewase
Copy link
Contributor Author

Hey thanks for taking this up, I am ok with both methods.
Added you as a collaborator in my fork of this repo, and I see Maintainers are allowed to edit this pull request. in the right panel.

@michael-s-molina
Copy link
Member

Added you as a collaborator in my fork of this repo, and I see Maintainers are allowed to edit this pull request. in the right panel.

Thanks @mayurnewase. I'll rebase the PR and modify its scope a little bit to avoid introducing a breaking change. I'll move the migration script to its own PR, similar to #23973 and also keep the legacy plugin. The new scope will be to just add the ECharts Bubble chart which will allow us to merge this PR without the need to wait for a major version release.

@michael-s-molina michael-s-molina changed the title feat: migrate bubble chart to echarts feat: Adds the ECharts Bubble chart Sep 20, 2023
@michael-s-molina michael-s-molina marked this pull request as draft September 20, 2023 11:16
@michael-s-molina michael-s-molina marked this pull request as ready for review September 20, 2023 16:40
@michael-s-molina
Copy link
Member

I deprecated the legacy chart and added thumbnails for the new version.

Screenshot 2023-09-20 at 13 41 49

@michael-s-molina
Copy link
Member

/testenv up

@github-actions
Copy link
Contributor

@michael-s-molina Ephemeral environment spinning up at http://34.217.102.24:8080. Credentials are admin/admin. Please allow several minutes for bootstrapping and startup.

Copy link
Member

@villebro villebro left a comment

Choose a reason for hiding this comment

The reason will be displayed to describe this comment to others. Learn more.

I think this looks great. The only nit that comes to mind is different handling of the title and missing colors in the tooltip:

legacy:
image

new:
image

But as discussed a few months ago, I think we have some tooltip harmonization and re-styling work to do anyway, so maybe this can be deferred to that effort.

@michael-s-molina
Copy link
Member

Thanks for the review @villebro!

But as discussed a few months ago, I think we have some tooltip harmonization and re-styling work to do anyway, so maybe this can be deferred to that effort.

Yes, let's tackle this in a follow-up as part of the harmonization and re-styling work.

@michael-s-molina michael-s-molina merged commit c81c60c into apache:master Oct 5, 2023
46 checks passed
@github-actions
Copy link
Contributor

github-actions bot commented Oct 5, 2023

Ephemeral environment shutdown and build artifacts deleted.

cccs-rc pushed a commit to CybercentreCanada/superset that referenced this pull request Mar 6, 2024
Co-authored-by: Michael S. Molina <michael.s.molina@gmail.com>
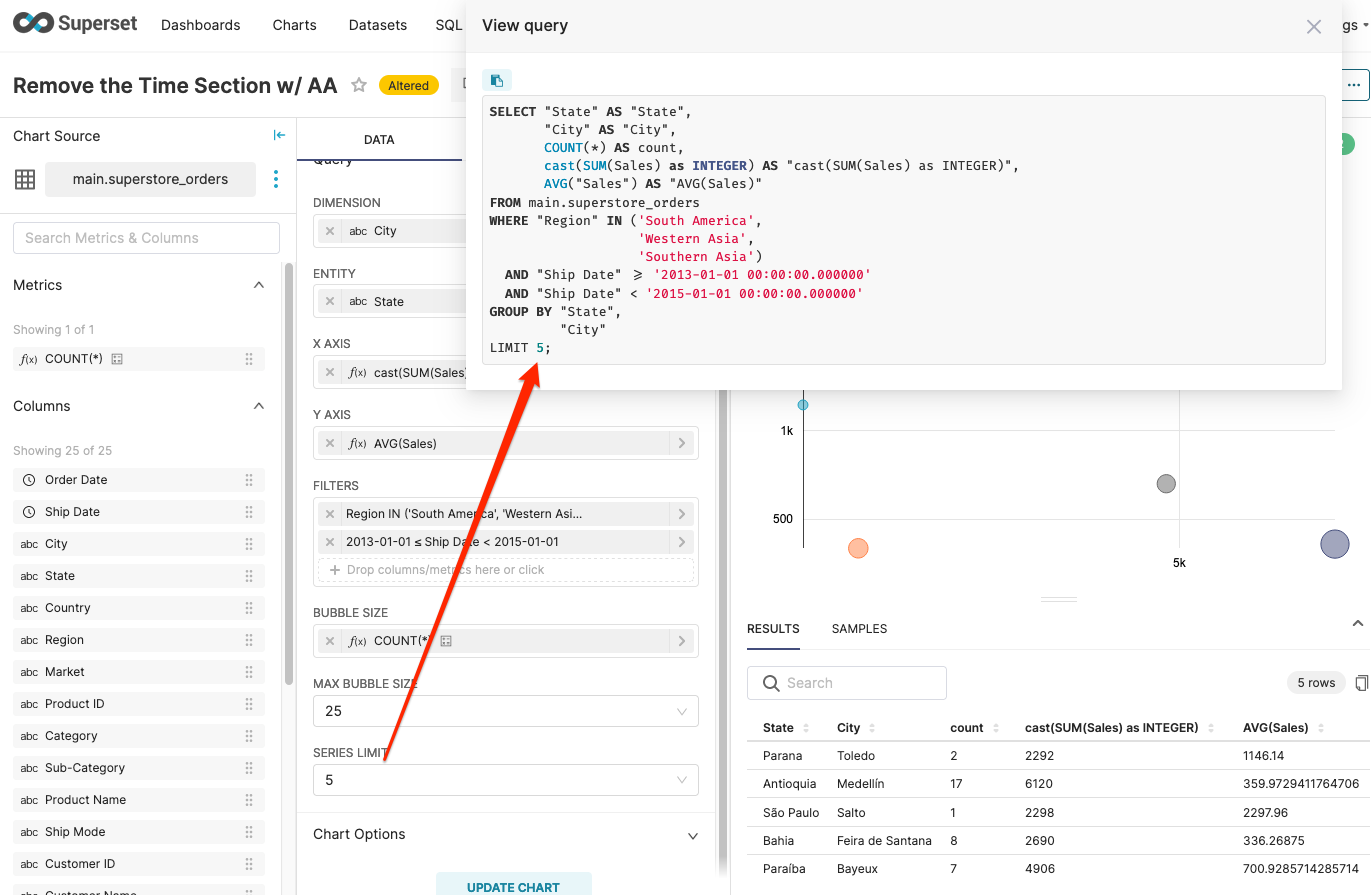
@mistercrunch mistercrunch added 🏷️ bot A label used by `supersetbot` to keep track of which PR where auto-tagged with release labels 🚢 3.1.0 labels Mar 13, 2024
Sign up for free to join this conversation on GitHub. Already have an account? Sign in to comment
Labels
🏷️ bot A label used by `supersetbot` to keep track of which PR where auto-tagged with release labels size/XXL 🚢 3.1.0
Projects
None yet
Development

Successfully merging this pull request may close these issues.

8 participants