In this lesson, we'll review all the guidelines and specifications for the final project for Module 4.
- Understand all required aspects of the Final Project for Module 4
- Understand all required deliverables
- Understand what constitutes a successful project
Another module down--you're absolutely crushing it! For this project, you'll get to flex your Time-Series muscles!

For this module's final project, we're going to put your newfound Time Series Analysis skills to the test. You will be forecasting real estate prices of various zipcodes using data from Zillow. However, this won't be as straightforward as just running a time-series analysis--you're going to have to make some data-driven decisions and think critically along the way!
For this project, you will be acting as a consultant for a fictional real-estate investment firm. The firm has asked you what seems like a simple question:
what are the top 5 best zipcodes for us to invest in?
This may seem like a simple question at first glance, but there's more than a little ambiguity here that you'll have to think through in order to provide a solid recommendation. Should your recommendation be focused on profit margins only? What about risk? What sort of time horizon are you predicting against? Your recommendation will need to detail your rationale and answer any sort of lingering questions like these in order to demonstrate how you define "best".
As mentioned previously, the data you'll be working with comes from the Zillow Research Page. However, there are many options on that page, and making sure you have exactly what you need can be a bit confusing. For simplicity's sake, we have already provided the dataset for you in this repo--you will find it in the file zillow_data.csv.
The goal of this project is to have you complete a very common real-world task in regard to Time-Series Modeling. However, real world problems often come with a significant degree of ambiguity, which requires you to use your knowledge of statistics and data science to think critically about and answer. While the main task in this project is Time-Series Modeling, that isn't the overall goal--it is important to understand that Time-Series Modeling is a tool in your toolbox, and the forecasts it provides you are what you'll use to answer important questions.
In short, to pass this project, demonstrating the quality and thoughtfulness of your overall recommendation is at least as important as successfully building a Time-Series model!
Online students should complete the following 4 deliverables for this project:
- A well-documented Jupyter Notebook containing any code you've written for this project (use the notebook in this repo,
mod_4_starter_notebook.ipynb). This work will need to be pushed to your GitHub repository in order to submit your project. - An organized README.md file in the GitHub repository that describes the contents of the repository. This file should be the source of information for navigating through the repository.
- A Blog post.
- An 'Executive Summary' PowerPoint Presentation that explains your rationale and methodology for determining the best zipcodes for investment.
Note: On-campus students may have different deliverables, please speak with your instructor.
For this project, you will be provided with a jupyter notebook containing some starter code. If you inspect the zillow dataset file, you'll notice that the datetimes for each sale are the actual column names--this is a format you probably haven't seen before. To ensure that you're not blocked by preprocessing, we've provided some helper functions to help simplify getting the data into the correct format. You're not required to use this notebook or keep it in its current format, but we strongly recommend you consider making use of the helper functions so you can spend your time working on the parts of the project that matter.
The notebook should be well organized, easy to follow, and code is modularized and commented where appropriate.
- Level Up: The notebook contains well-formatted, professional looking markdown cells explaining any substantial code. All functions have docstrings that act as professional-quality documentation.
- The notebook is written to technical audiences with a way to both understand your approach and reproduce your results. The target audience for this deliverable is other data scientists looking to validate your findings.
- Data visualizations you create should be clearly labeled and contextualized--that is, they fit with the surrounding code or problems you're trying to solve. No dropping data visualizations randomly around your notebook without any context!
Your notebook should briefly mention the metrics you have defined as "best", so that any readers understand what technical metrics you are trying to optimize for (for instance, risk vs profitability, ROI yield, etc.). You do not need to explain or defend your your choices in the notebook--the blog post and executive summary presentation are both better suited to that sort of content. However, the notebook should provide enough context about your definition for "best investment" so that they understand what the code you are writing is trying to solve.
Time-Series Analysis is an area of data science that lends itself well to intuitive data visualizations. Whereas we may not be able to visualize the best choice in a classification or clustering problem with a high-dimensional dataset, that isn't an issue with Time Series data. As such, any findings worth mentioning in this problem are probably also worth visualizing. Your notebook should make use of data visualizations as appropriate to make your findings obvious to any readers.
Also, remember that if a visualization is worth creating, then it's also worth taking the extra few minutes to make sure that it is easily understandable and well-formatted. When creating visualizations, make sure that they have:
- A title
- Clearly labeled X and Y axes, with appropriate scale for each
- A legend, when necessary
- No overlapping text that makes it hard to read
- An intelligent use of color--multiple lines should have different colors and/or symbols to make them easily differentiable to the eye
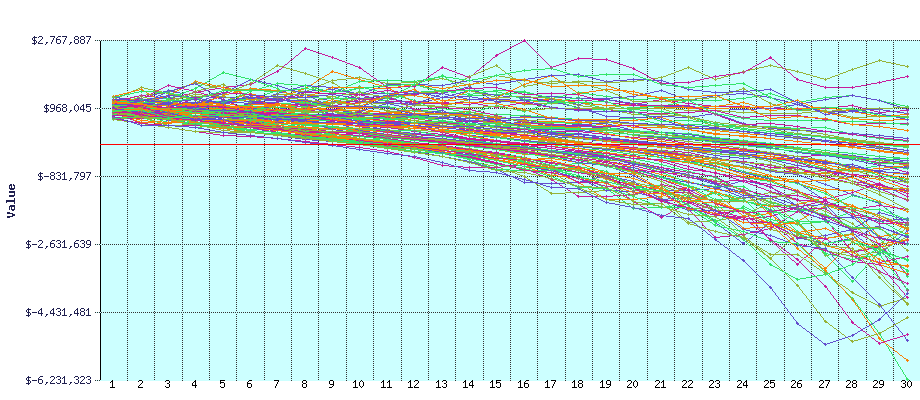
- An appropriate amount of information--avoid creating graphs that are "too busy"--for instance, don't create a line graph with 25 different lines on it

Refer back to the Blogging Guidelines for the technical requirements and blog ideas.
Your presentation should:
Contain between 5-10 professional quality slides detailing:
- A high-level overview of your methodology and findings, including the 5 zipcodes you recommend investing in
- A brief explanation of what metrics you defined as "best" in order complete this project
As always, this prresentation should also:
- Take no more than 5 minutes to present
- Avoid technical jargon and explain results in a clear, actionable way for non-technical audiences.
Online students can find a PDF of the grading rubric for the project here. Note: On-campus students may have different requirements, please speak with your instructor.