

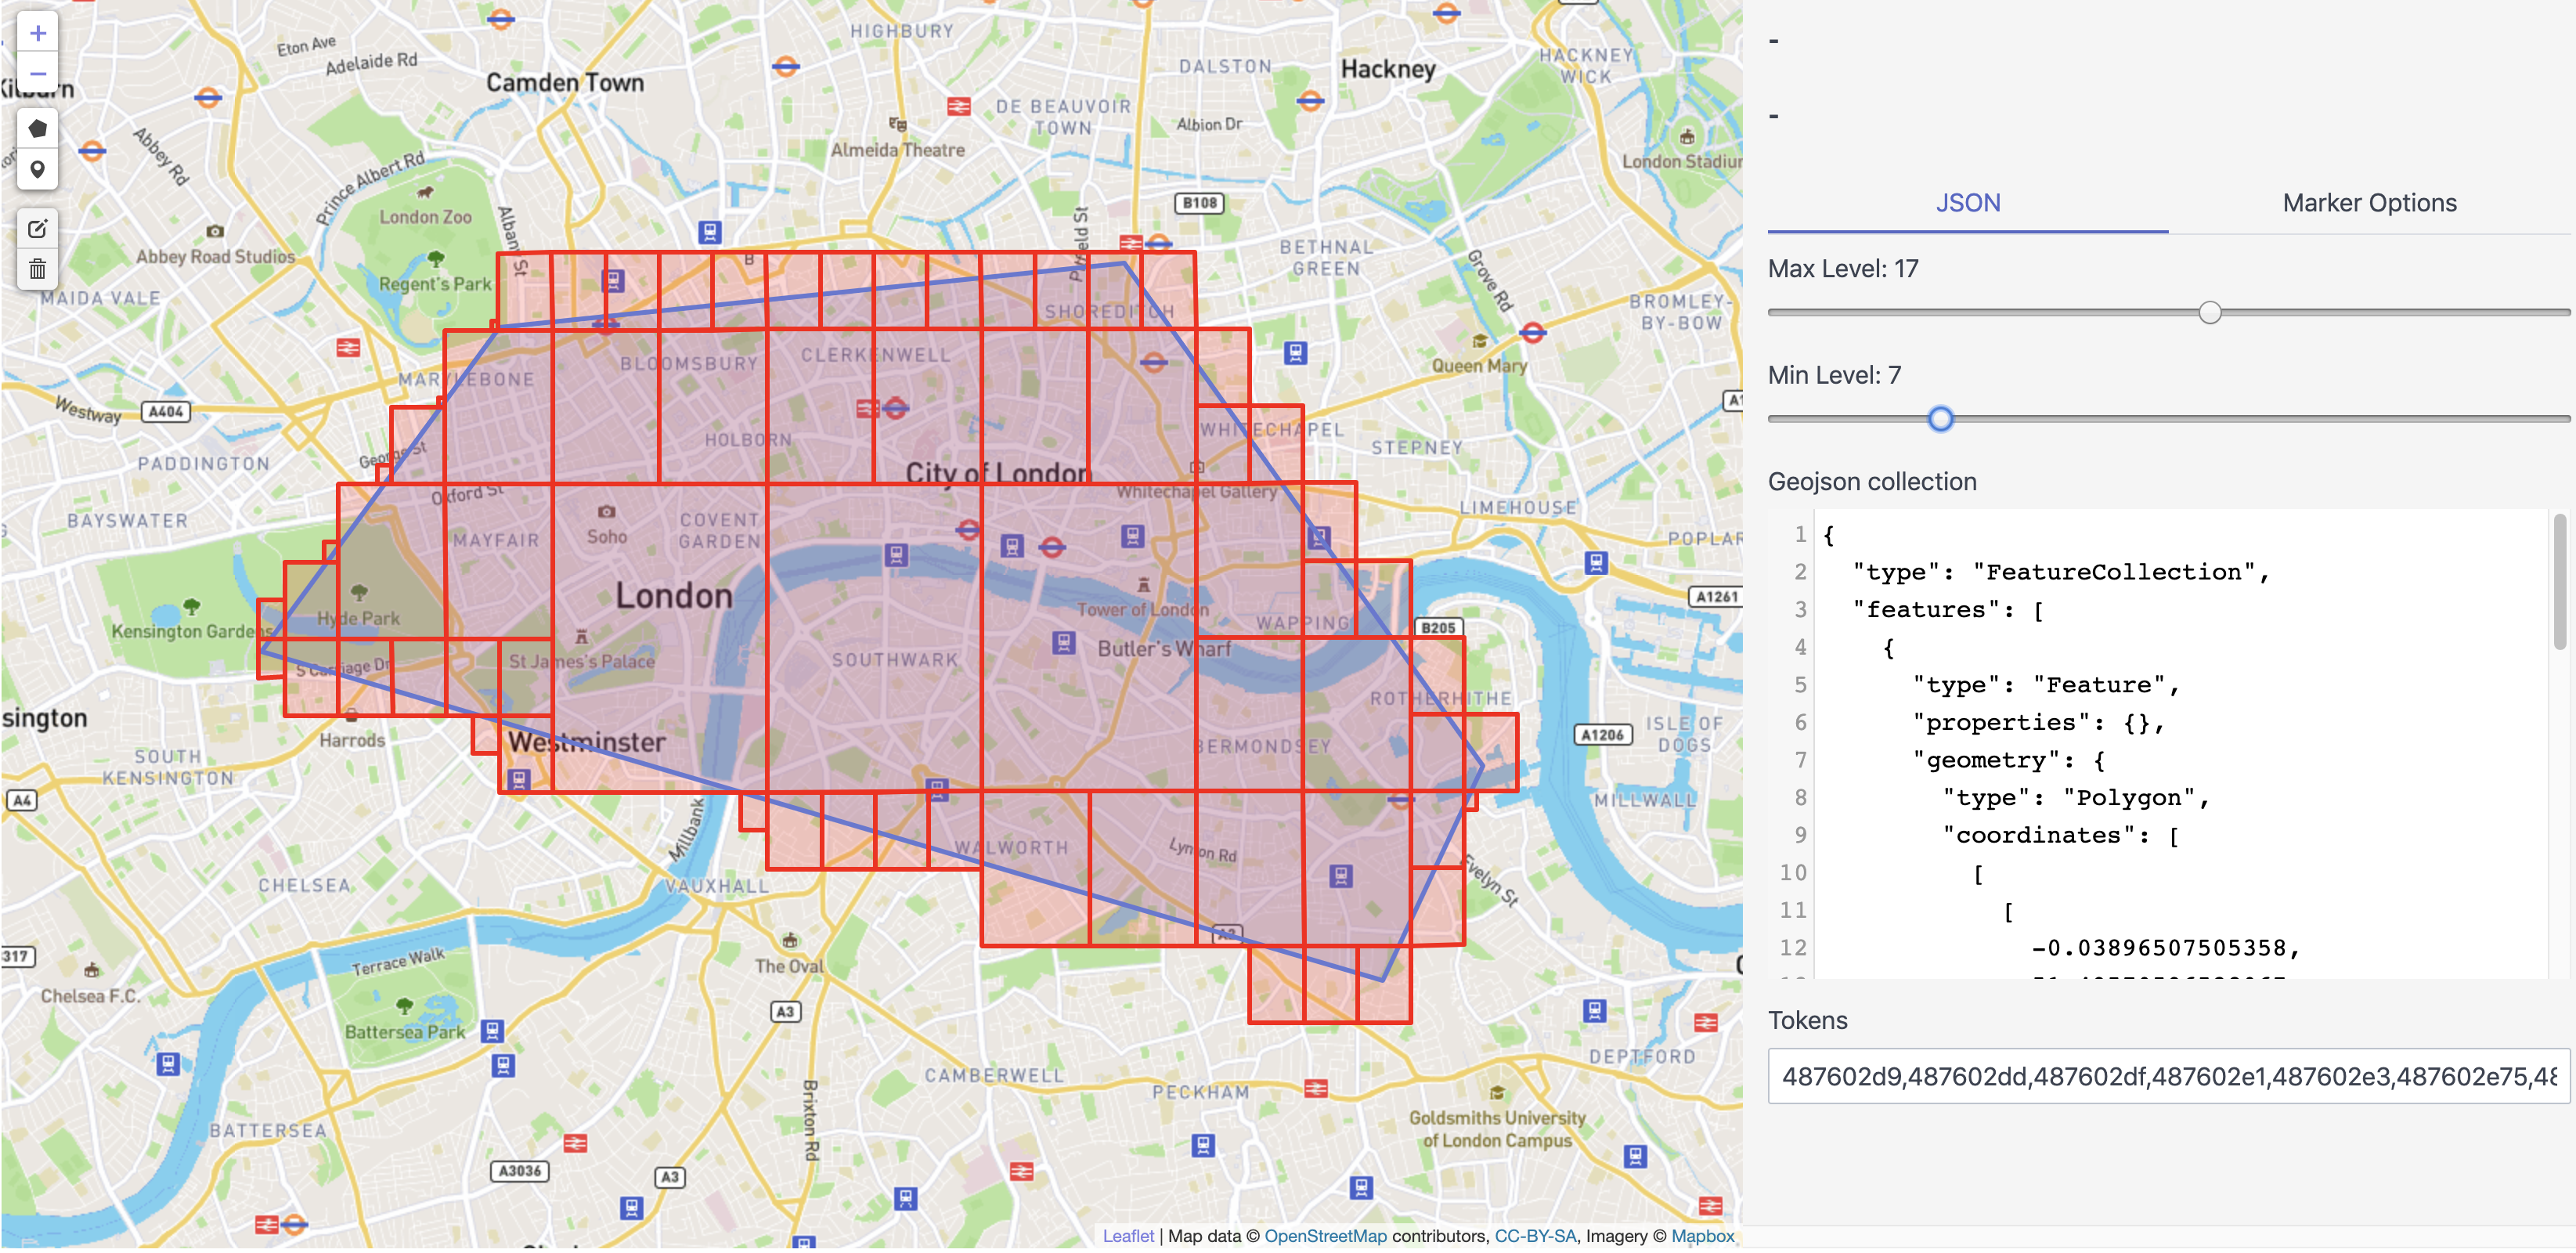
Draw a polygon on the map or paste a geoJSON and explore how the s2.RegionCoverer covers it with S2 cells depending on the min and max levels. Drop a marker and inspect the corresponding S2 cell.
- Display s2 cells on leaflet map using the region coverer.
- Convert geojson features to cell unions depending on the min and max levels (supported only Polygons and Points).
- Draw points and polygons.
- Check point & circle intersection with the geoJSON features.
go run cmd/s2-geojson/main.go
docker run -p 8080:8080 --rm lmaroulis/s2-geojson
This project is licensed under the MIT License - see the LICENSE file for details.