- Repository for my master thesis
- In this paper, we introduce the anomaly detection using deep learning models and the explanation with MSTs in the US stock market. And we describe the mathematical formulation for the RNN/LSTM.
- Jul. 1, 2022 ~ Jan. 6, 2023
미국 주식시장 분석을 위한 딥러닝 접근법과 상관관계 네트워크를 이용한 해석
Abstract Neural networks are artificial intelligence algorithms that excel at pattern recognition tasks and have been widely used to handle time series data. In particular, the anomaly detection of time series plays an important role in the financial field. Most previous efforts related to time series anomaly detection have been aimed at improving the performance of model. But these days, some studies in the financial field emphasize the need to explain the AI models. In this paper, we detect anomalous behaviors on US stock market using Long short term memory (LSTM) algorithms based on neural networks. And, we propose a method to increase the explanatory power and confidence of deep learning by representing the predictive results on minimum spanning trees (MSTs). We show that this approach gives insight into anomaly pattern, which is compared to the past dynamics in stock market. And we explain it in relation to Covid-19 pandemic.
- Closing prices of DOW-30 (except DOW stock) retrieved using the Yahoo Finance API for the period between 2008-06-02 and 2021-01-29.
- The return is calculated separately for each stock, and the LSTM learning is also performed separately.


Anomaly Detection Using LSTMs | Code
- We use the LSTM architecture with 64 nodes following ReLU activation function and a neural network with 1-layer (Dense layer) with a node.
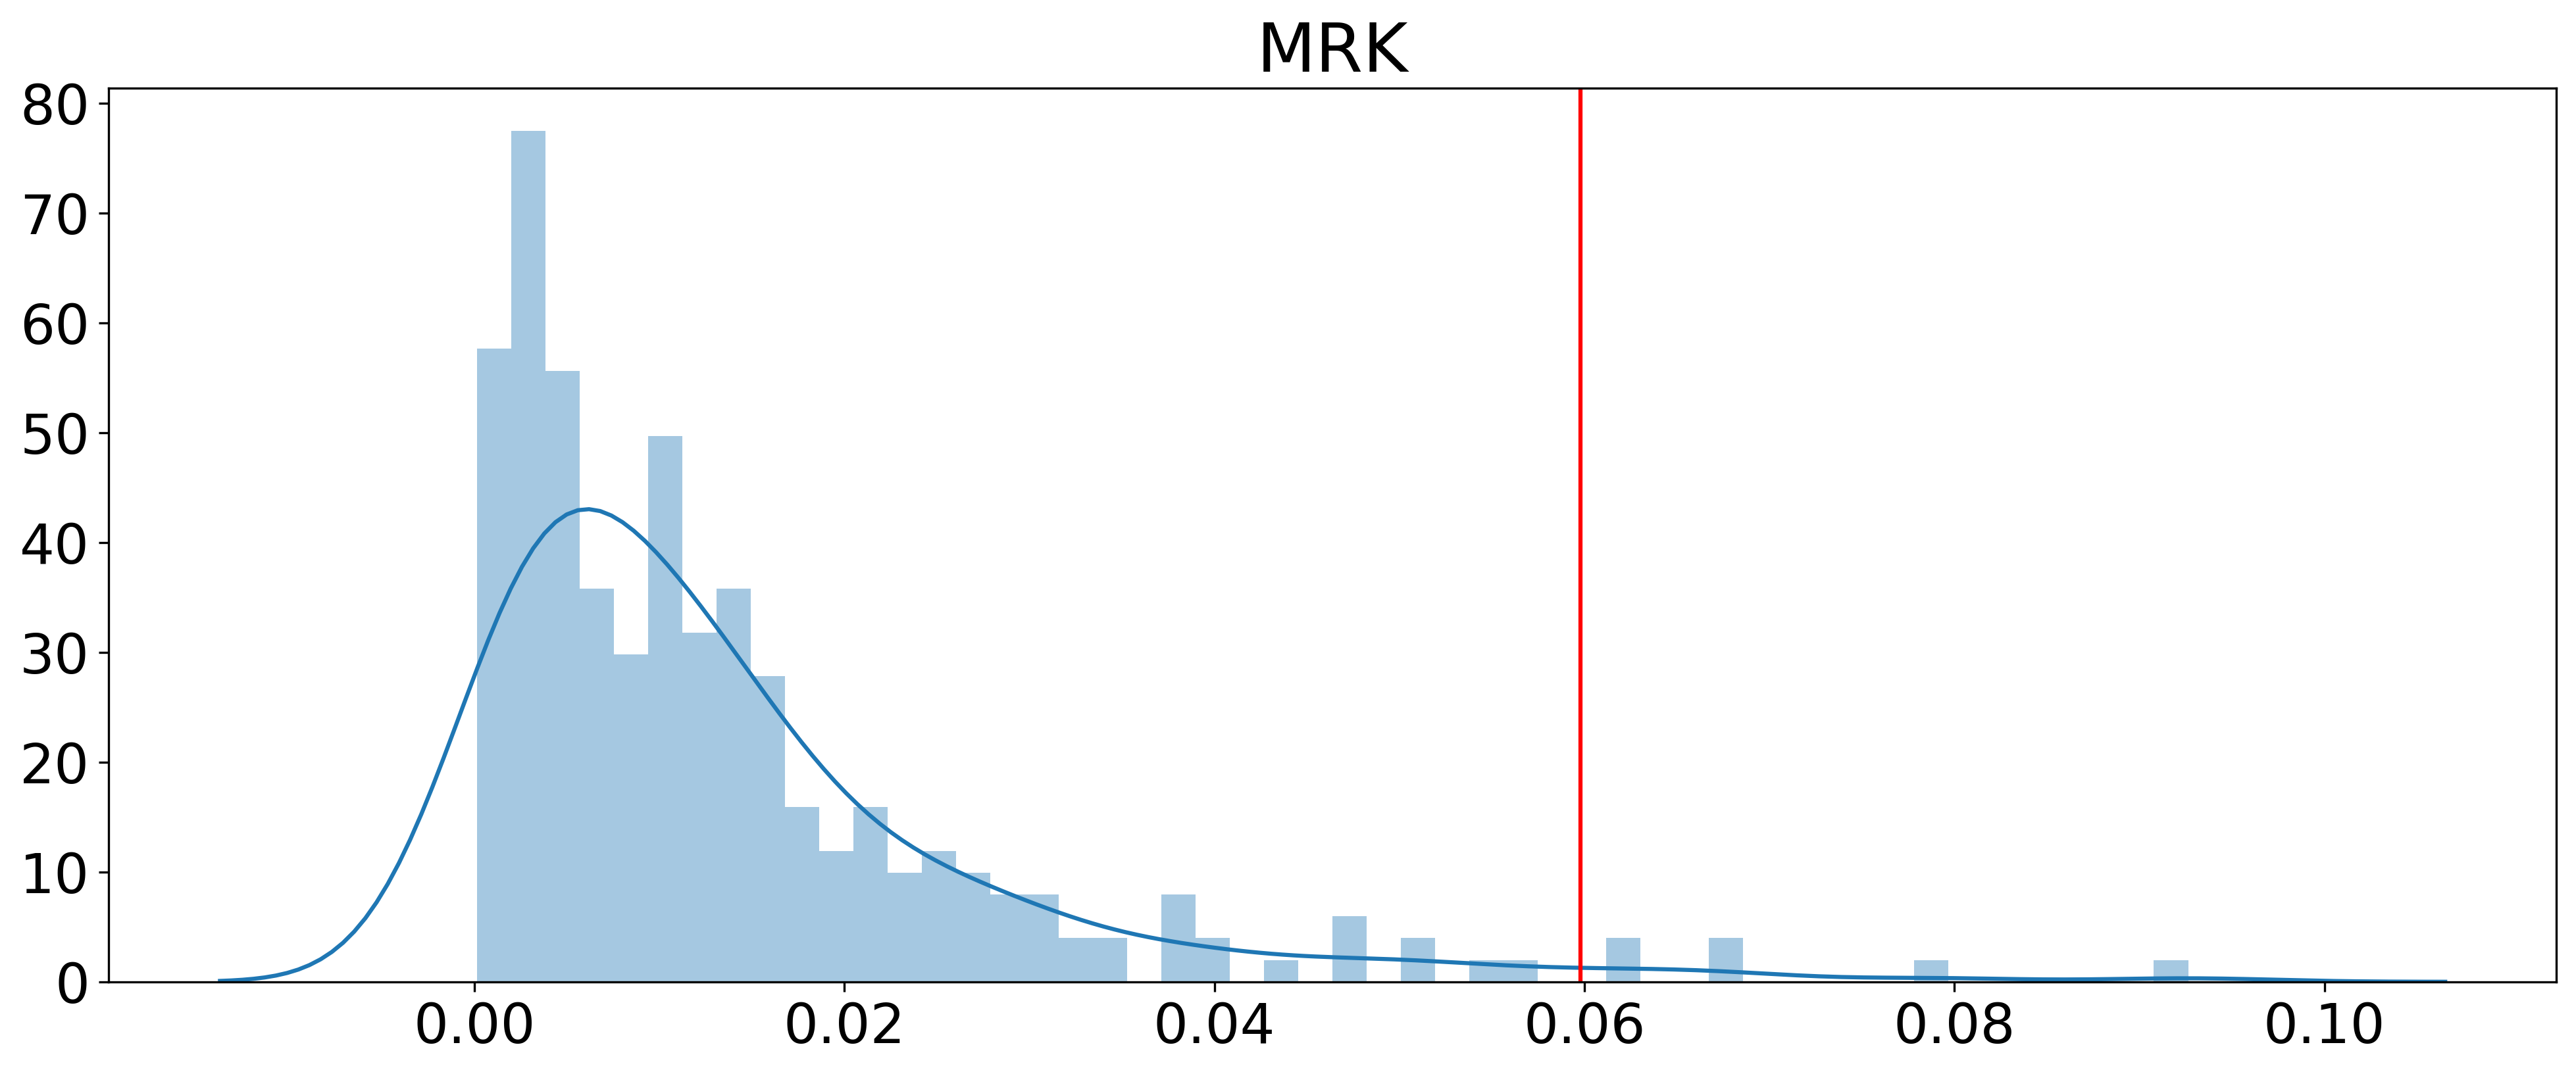
- The thresholds that determine the anomaly points are calculated by 0.99 quantile value of the train mean squared error (MSE). In the test MSE, points larger than thresholds were determined as anomaly points.
- The histogram for the test MSE and the threshold value obtained by the train MSE for CVX, INTC,MRK and XOM are depicted below.


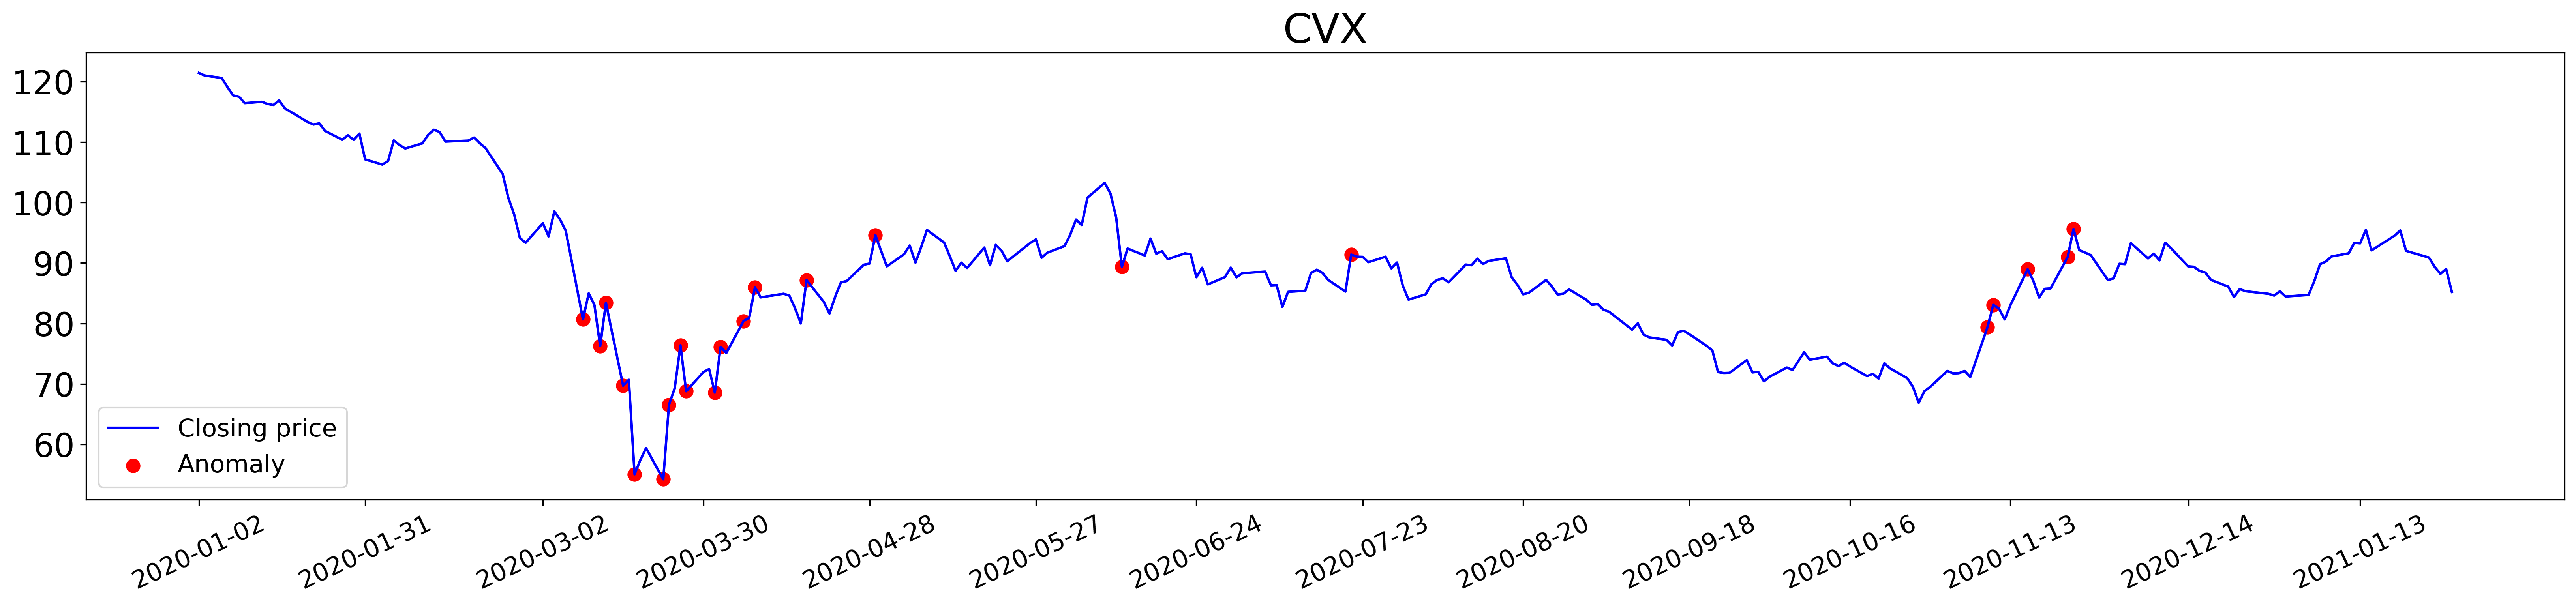
- Anomaly points and closing prices for CVX, INTC, MRK and XOM are as follows:


MST representation | Code
- We generate MSTs using the daily return value of the closing price for the last 272 days. We divide 272 days into four sections and mark the number of anomaly points in each section in color on each node of MSTs. The closer to the orange, the more the number is.


