This project aims to apply the EDA skills that we learned during the bootcamp in order to analyze the bike traffic in Paris.
For this project, these were the tools that we used:
- Pandas
- NumPy
- Matplotlib
- Tableau
We wanted to answer the following questions through data analysis:
- What are the arrondissements with most traffic?
- Did Covid affect traffic, before, during, and after?
- What is the time of day and day of the week with most traffic? Is it the same in every arrondissement?
- Is the traffic seasonal?
- Is the increase in car traffic leading to more bike accidents?
- Is the increase bikes lanes helping in the drecrease of bike accidents?
- Is the increase of bike traffic leading to more bike lanes? And in which areas?
To analyze the bike traffic in Paris, we found several data sources that could help on the French Government website: https://www.data.gouv.fr/en/datasets
In this website we managed to find most of the data that we needed:
- Accidents de Vélo: Contains all the bike accidents in France since 2005
- Comptage vélo - Données compteurs: Contains the number of bikes captured by each traffic camera in Paris, each hour, from 2018 until today
- Réseau des itinéraires cyclables: Contains all the bike lanes of Paris
All of the files were in CSV so it was easy to read the them.
With the data sources indicated above (and some data cleaning as well), we could start answering the questions that started this project:
Is there an increase in bike traffic in Paris?
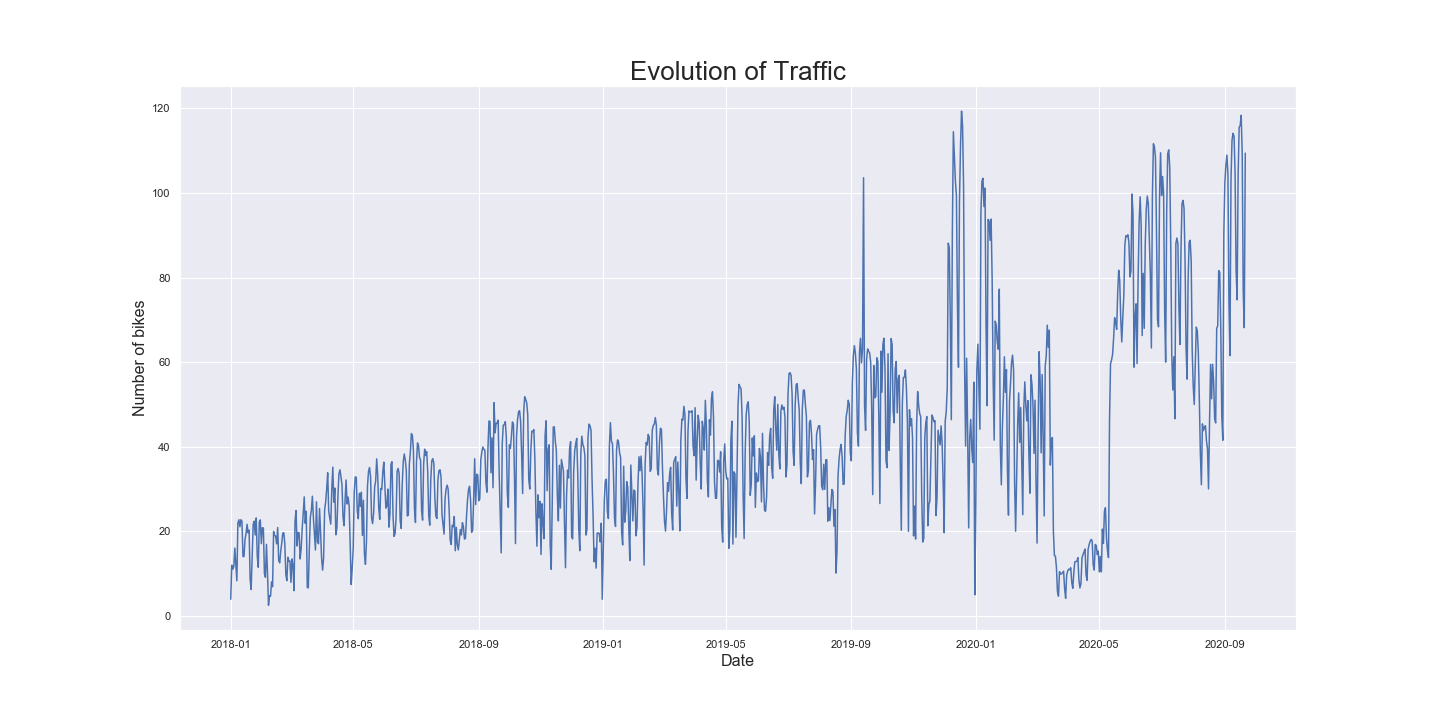
From the image above we can clearly see an increase in bike traffic from the beginning of 2018 until now. We can also see the impact that COVID had in traffic, from March until the end of May. The increase in traffic this year, especially right after the end of the confinement in May, could be related to the fact that people want to avoid public transportation and, therefore, prefer to use a personal means of transport, like a bike.
Is the traffic seasonal?
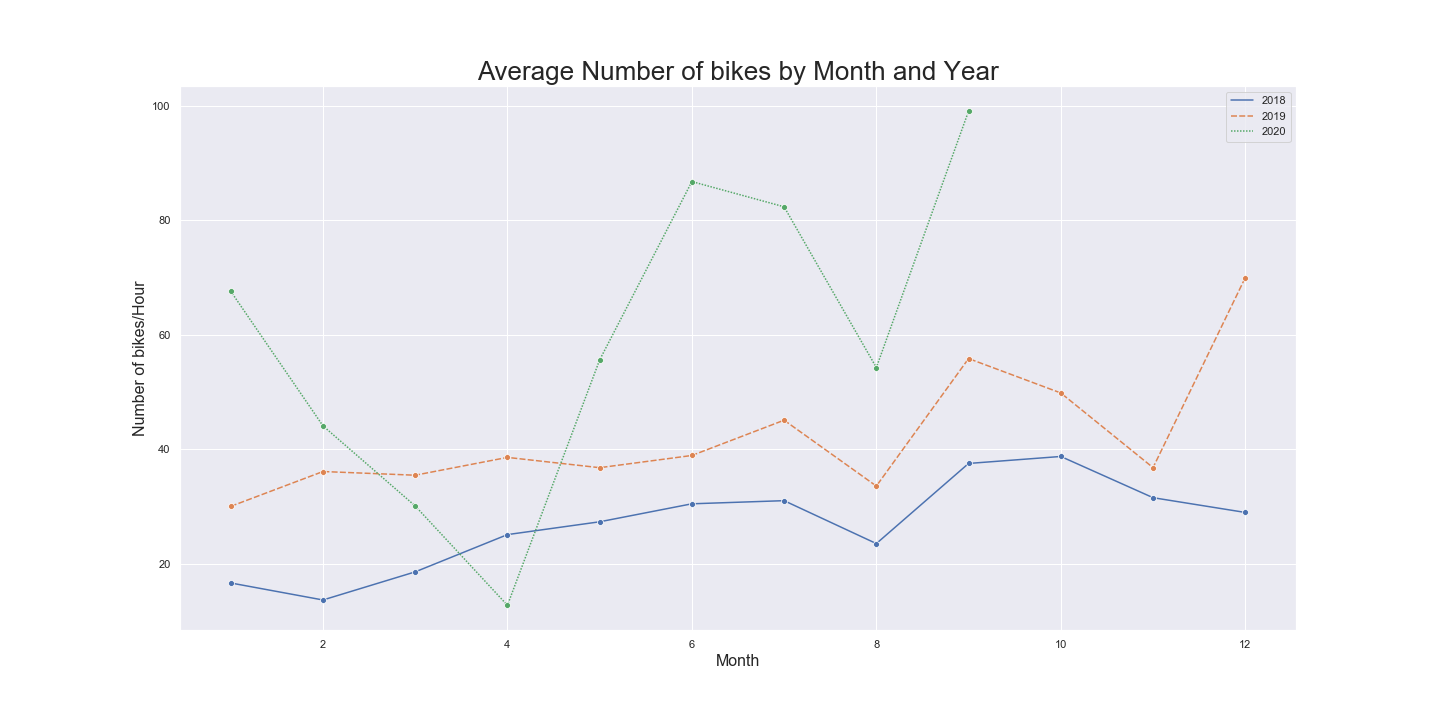
To answer this question we not only created a line chart by month with the average number of bikes per hour, but also added a line per year to compare and to avoid the year 2020 having a big influence in certain months, like the confinement. We notice that the bike traffic is indeeed seasonal along the year:
- There is a decrease in traffic during the month of August, which is related to the summer holidays;
- Except for August, bike traffic is higher during the summer than in the winter;
- There is, however, an increase in bike traffic during the month of December of 2019. This is related to the strikes that ocurred on public transportation, which led people to resort to other means of commuting to work.
What are the Arrondissements with the highest amount of bike traffic?
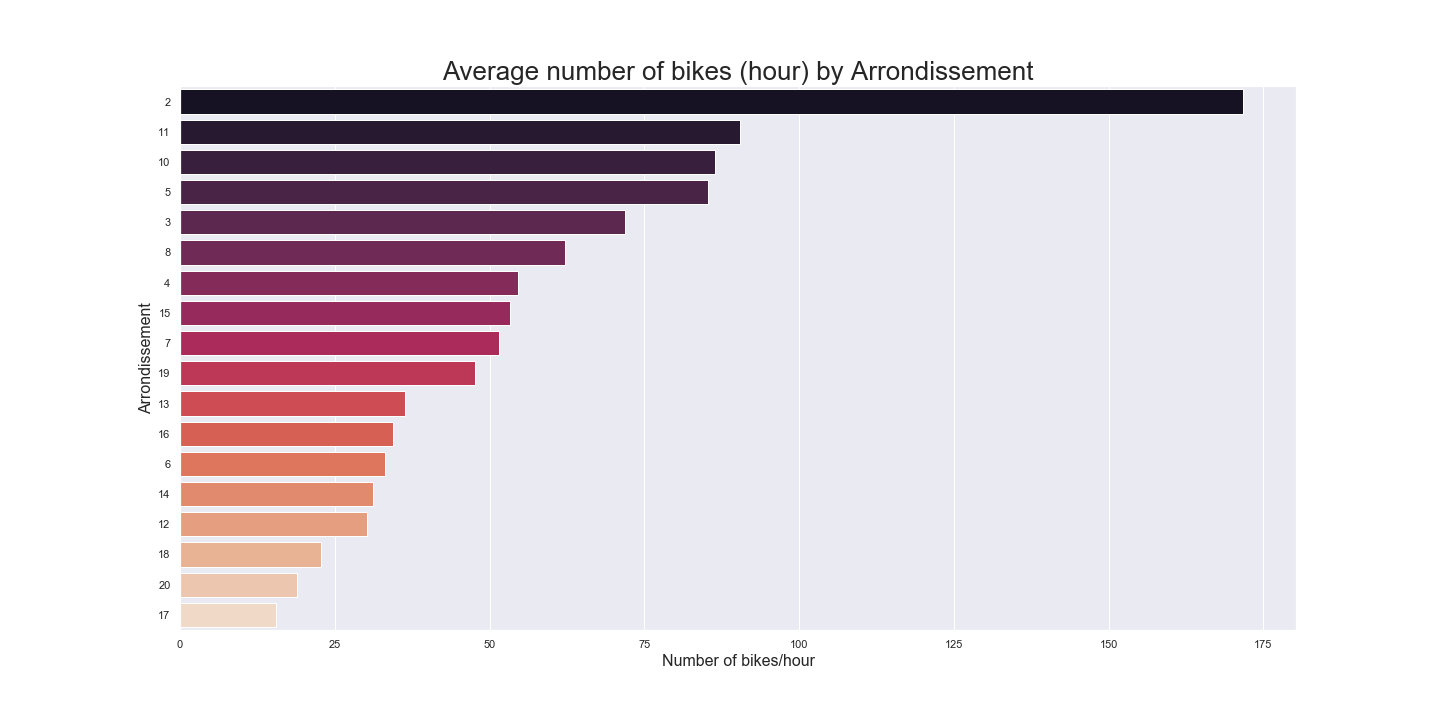
The bar chart above shows the average number of bikes per hour, per arrondissement, so that we can compare them on the same scale. And we can conclude that the 2nd Arrondissement is, by far, the one with the highest amount of bike traffic. Which makes sense because this arrondissement is located in the center of Paris, and it is a major crossroad between the biggest avenues in Paris. Right after the 2nd Arrondissement, we have the 11th, 10th and 5th Arrondissements with around the average amount of bikes per hour. The Arrondissements with the lowest traffic are the 17th and 20th, which are located in the periphery of Paris, which is more suburban and not the main point of destination during rush hour.
So now that we have looked that bike traffic, we wanted to see if the number of accidents followed the same trend to see if there was some correlation.
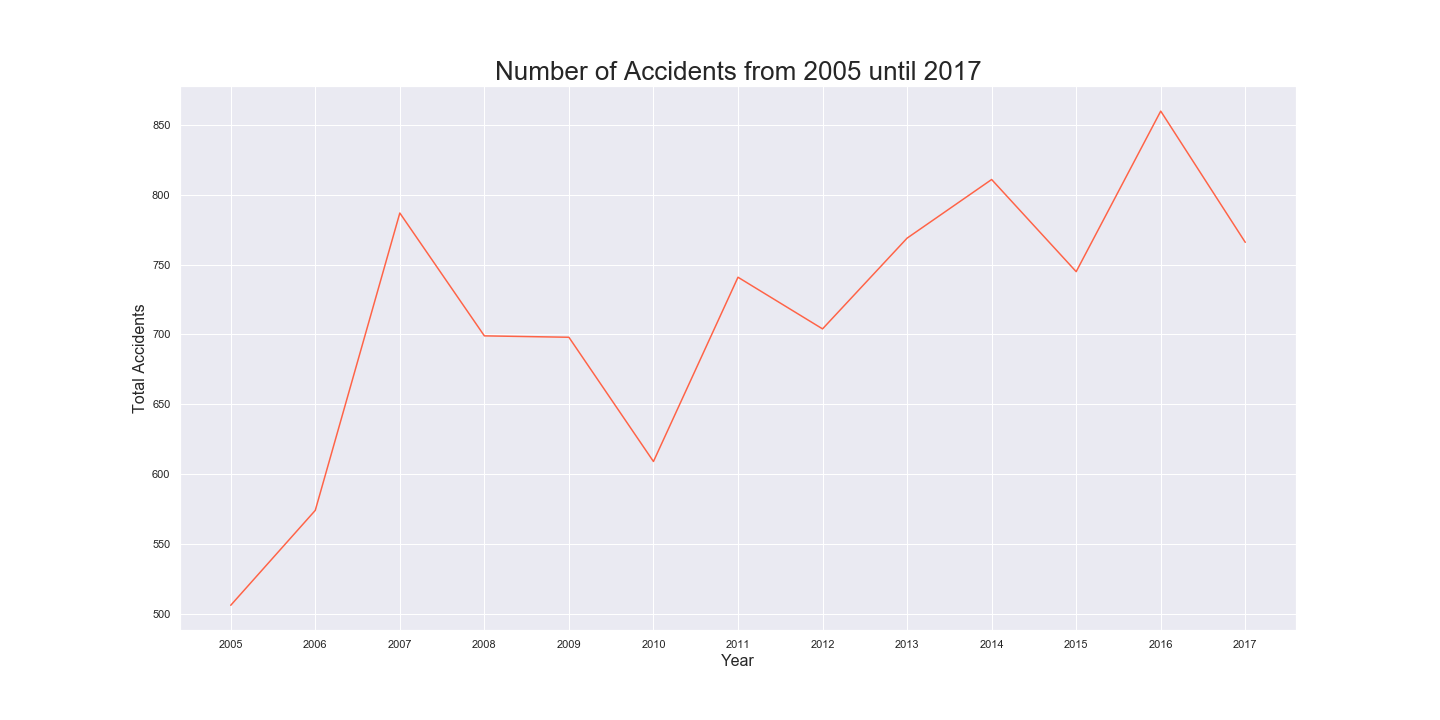
The line graph above shows the number of bike accidents in Paris, from 2005 until 2017. We can see at steady increase in this volume, which could be correlated with the increase in the number of bikes being used Paris, like we saw on the graphs before. However, we cannot say for sure because, not only we don't have information about bike accidents until 2020 but also there could be other factors associated with the increase of bike accidents that we could be ignoring.
Nevertheless, let's see if the number of bike accidents is also follows a cycle like the bike traffic.

We can see that the number of bike accidents increases during rush hour, which is understandable given the fact that not only there are more bikes circulating during that period, but also cars and pedestrians. And we have the lowest number of bike accidents during the night, which in this case we can assume that it is correlated with the bike traffic.
And like the bike traffic, what are the arrondissements with the highest number of bike accidents?
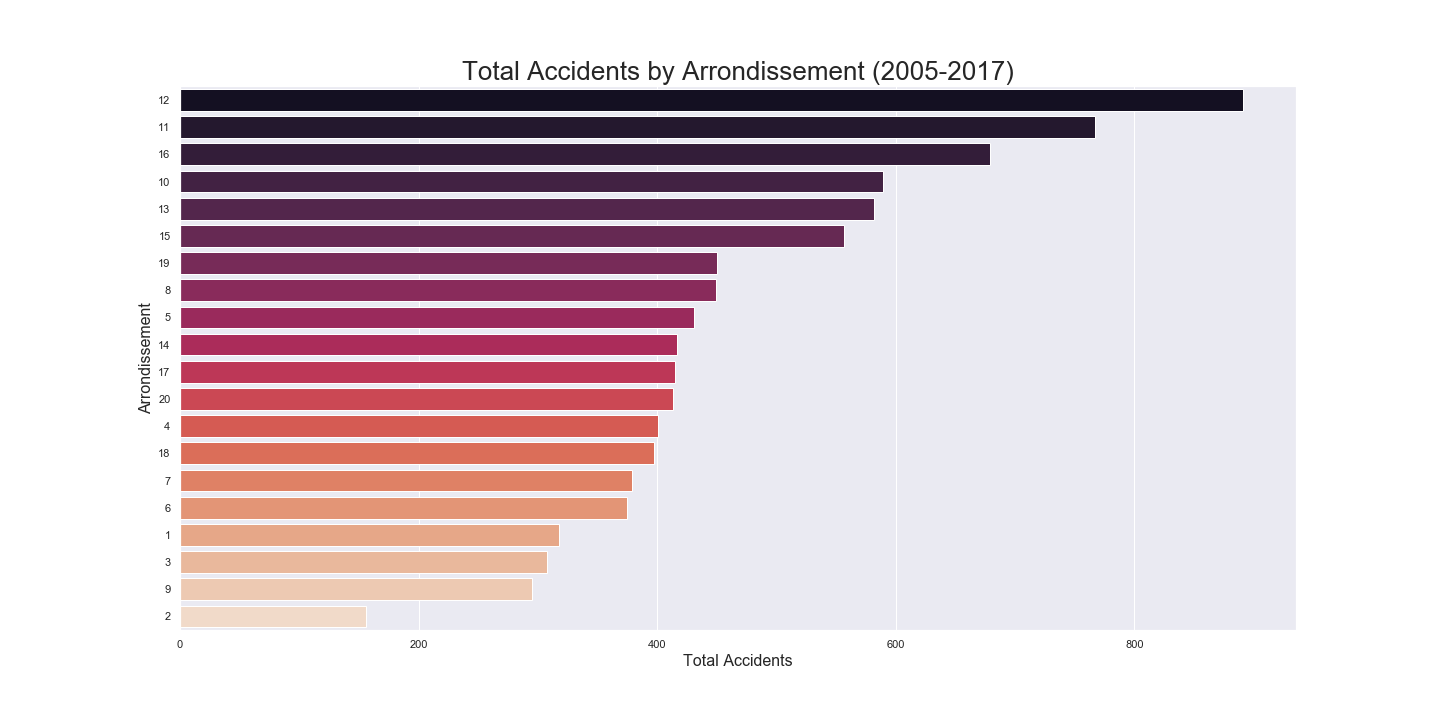
Surprisingly, the arrondissements with the highest bike traffic are actually the ones that have registered the lowest number of bike accidents, with the 2nd arrondissement in the bottom of the list. The arrondissements with the highest number of bike accidents are actually the ones located in the periphery.
We can clearly see that parisians are choosing to ride a bicycle instead of using public transports, especially in this year. Wether it is related to COVID or simply to a change of lifestyle, bike traffic has been increasing steadily and, at this current rate, next year might show even higher numbers. With bike traffic might come an increase in bike accidents as well, which is why the construction the bike lanes and sinalization is important to keep up with this new trend.
I would like to thank the contribution of Etienne Leconte in this project, especially in the visualizations done in Tableau. I also want to thank my teacher Eldiias for his valuable insights and feedback during the course of this project.