Exploring imaging features across subjects over regions-of-interest (ROI) is
something quite typical in neuroimaging analysis workflows. roistats is a
collection of basic Python functions based on standard packages which allow
easier collection and visualization of ROI values.
See an example there.
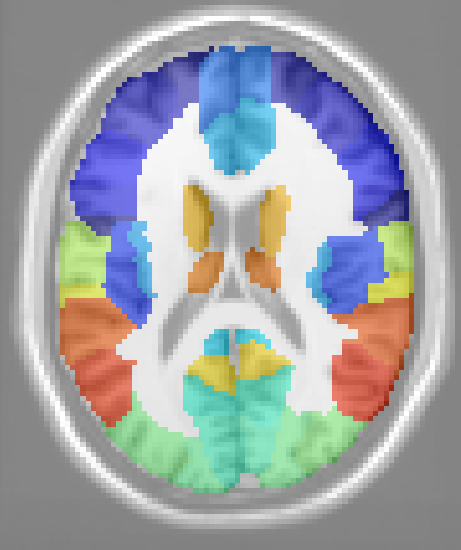
In this context a ROI atlas defined as a label volume, i.e. an image in which every voxel is assigned a label from a specific set. Each label is associated to a given region/structure of the brain. The next figure represents the AAL ROI atlas overlaid on the MNI reference template.
From a set of images maps_fp (from a list of subjects subjects) registered
to the same reference atlas atlas_fp, the following command will then generate
a pandas DataFrame with mean values from
every label/region from the atlas:
from roistats import collect
collect.roistats_from_maps(maps_fp, atlas_fp, subjects, func=np.mean, n_jobs=7)
func is the function used to aggregate the values from each label, n_jobs
allows to parallelize the process in multiple jobs. The subjects list will
be taken as index of the produced DataFrame.
Each label will be assigned a different column of the DataFrame.
To date it is only available as a raw (probably dirty) code but please open an issue if making it available on main package repositories may be useful to you and I will make the effort.

